DMelt:General/4 Small Screen Devices
Small-screen devices
You can use an alternative version of DataMelt for small-screen devices:
For Linux/Unix/Mac systems, run dmelt_porto.sh For Windows operating system, run
dmelt_porto.bat
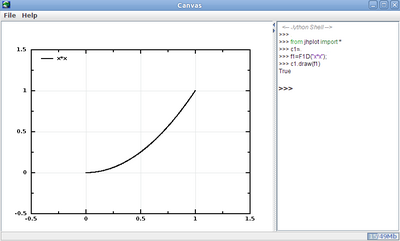
Here is a small example that shows how it looks:
This image is modified to protect proprietary libraries which are currently available for full DataMelt members. |
.
The functionality of the IDE is essentially the same as for the desktop edition. The only difference is that there is no the pop-up canvas frame, since the plotting canvas is fully integrated into the IDE. Unlike the desktop edition, the JythoShell is on the right side of this IDE. The code assist works exactly as for the desktop edition. The above image shows how to work with  jhplot.HPlot.
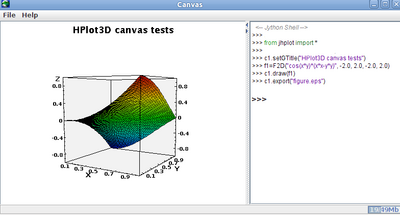
Analogously, one can use the 3D canvas to plot 3D functions, 2D histograms or data points in X-Y-Z.
The above image shows how to work with  jhplot.HPlot3D. Read more about this class
DMelt:Plots/1_Canvases
Look at the DataMelt IDE movie to see how it works.
It should be noted that an DMelt:General/Android of DataMelt is also available.
This version of IDE is under heavy development. However, already now one can use it essentially for all operations as for the desktop edition
Let us consider an example:
from jport import *
from jhplot import *
c1=HPort.get()
f1=F1D("x*x")
c1.draw(f1)
Here "c1" is the object of the  jhplot.HPlot.
It should be noted that if you will use the usual c1=HPlot("Canvas") (as for the desktop edition), the IDE will do replacement of this statement on the fly and convert it to HPort.get("Canvas").
You can run this example using [File]->[Open Jython file], or you can use the right window to type interactive commands. The main difference is that instead calling HPlot class, one should call the construction "c1=HPort.get()". Note, the standard approach when HPlot is called directly also works (but, in this case, you will see a pop-up window).
HPlot3D canvas
One can also use Here "c1" is the object of the  jhplot.HPlot3D for the small-screen devices. This canvas can be selected at the start-up time.
Let us consider an example which plots 3D function:
from jport import *
from jhplot import *
c1=HPort3D.get("canvas")
c1.visible(1)
c1.setGTitle("HPlot3D canvas tests")
f1=F2D("cos(x*y)*(x*x-y*y)", -2.0, 2.0, -2.0, 2.0)
c1.draw(f1)
c1.export("figure.eps")  # export to EPS format
It should be noted that if you will use the usual c1=HPlot3D("Canvas") (as for the desktop edition), the IDE will do replacement of this statement on the fly and convert it to "HPort3D.get". Here is another example showing interactive histogram
from jport import *
from jhplot import *
from java.util import Random

c1=HPort3D.get("canvas")
c1.setGTitle("HPlot3D canvas tests")
r=Random()
h1=H2D("My 2D Test1",30,-4.5, 4.5, 30, -4.0, 4.0)
for i in range(1000):
    h1.fill(r.nextGaussian(),r.nextGaussian())
c1.draw(h1)
c1.export("figure.eps")  # export to EPS format
For portable editions, it is impossible to make several pads on the same canvas (does not make much sense anyway since the screen is too small. Also, note that the method "visible()" is not used any more. Other functionality is exactly the same as for the desktop edition. |


