Scagnostics
From HandWiki
Short description: Scatterplot diagnostics measures
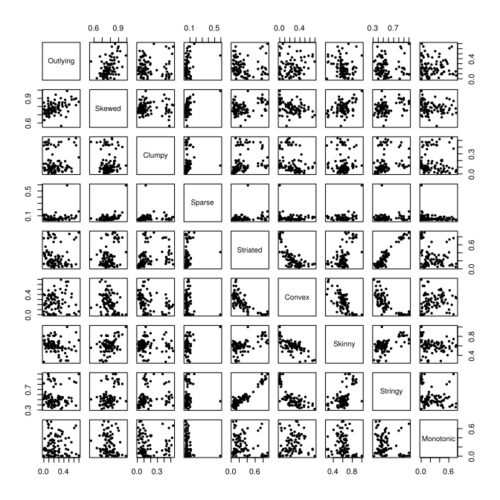
Scagnostics (scatterplot diagnostics) is a series of measures that characterize certain properties of a point cloud in a scatter plot. The term and idea was coined by John Tukey and Paul Tukey, though they didn't publish it; later it was elaborated by Wilkinson, Anand, and Grossman. The following nine dimensions are considered:[1][2]
- For the outliers in the data:
- outlying
- For the density of data points:
- skewed
- clumpy
- sparse
- striated
- For the shape of the point cloud:
- convex
- skinny
- stringy
- For trends in the data:
- monotony
References
- ↑ Wilkinson, Leland (23 April 2008) (in en). Scagnostics. https://escholarship.org/uc/item/9m31j1tb. Retrieved 25 March 2022.
- ↑ Wilkinson, Leland; Anand, Anushka; Grossman, Robert (2005). "Graph-theoretic scagnostics". In Proc. 2005 IEEE Symp. On Information Visualization (INFOVIS: 157–164.
 |


