File:Africa map showing population and grid infrastructure.png
From HandWiki

Size of this preview: 591 × 599 pixels. Other resolutions: 473 × 480 pixels | 848 × 860 pixels.
Original file (848 × 860 pixels, file size: 339 KB, MIME type: image/png)
Summary
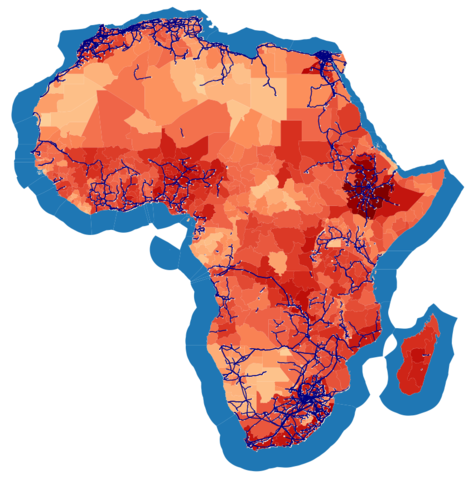
| Description |
English: A map of Africa as of 2022 showing population densities in red tones and the existing high-voltage transmission networks using blue lines. The diagram was produced by the PyPSA-Africa project and uploaded to Zenodo at doi:10.5281/zenodo.7180151. The processing scripts are available via the Zenodo page. |
| Date | |
| Source | https://doi.org/10.5281/zenodo.7180151 |
| Author | PyPSA-Earth authors |
Licensing
This file is licensed under the Creative Commons Attribution 4.0 International license.
- You are free:
- to share – to copy, distribute and transmit the work
- to remix – to adapt the work
- Under the following conditions:
- attribution – You must give appropriate credit, provide a link to the license, and indicate if changes were made. You may do so in any reasonable manner, but not in any way that suggests the licensor endorses you or your use.
File history
Click on a date/time to view the file as it appeared at that time.
| Date/Time | Thumbnail | Dimensions | User | Comment | |
|---|---|---|---|---|---|
| current | 09:39, 18 October 2022 | | 848 × 860 (339 KB) | imagescommonswiki>RobbieIanMorrison | Uploaded a work by PyPSA-Earth authors from https://doi.org/10.5281/zenodo.7180151 with UploadWizard |
File usage
The following file is a duplicate of this file (more details):
- File:Africa map showing population and grid infrastructure.png from Wikimedia Commons
The following page uses this file:

