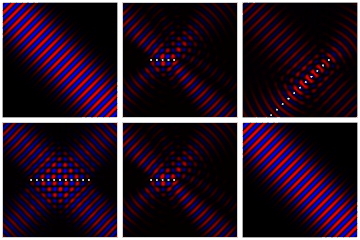
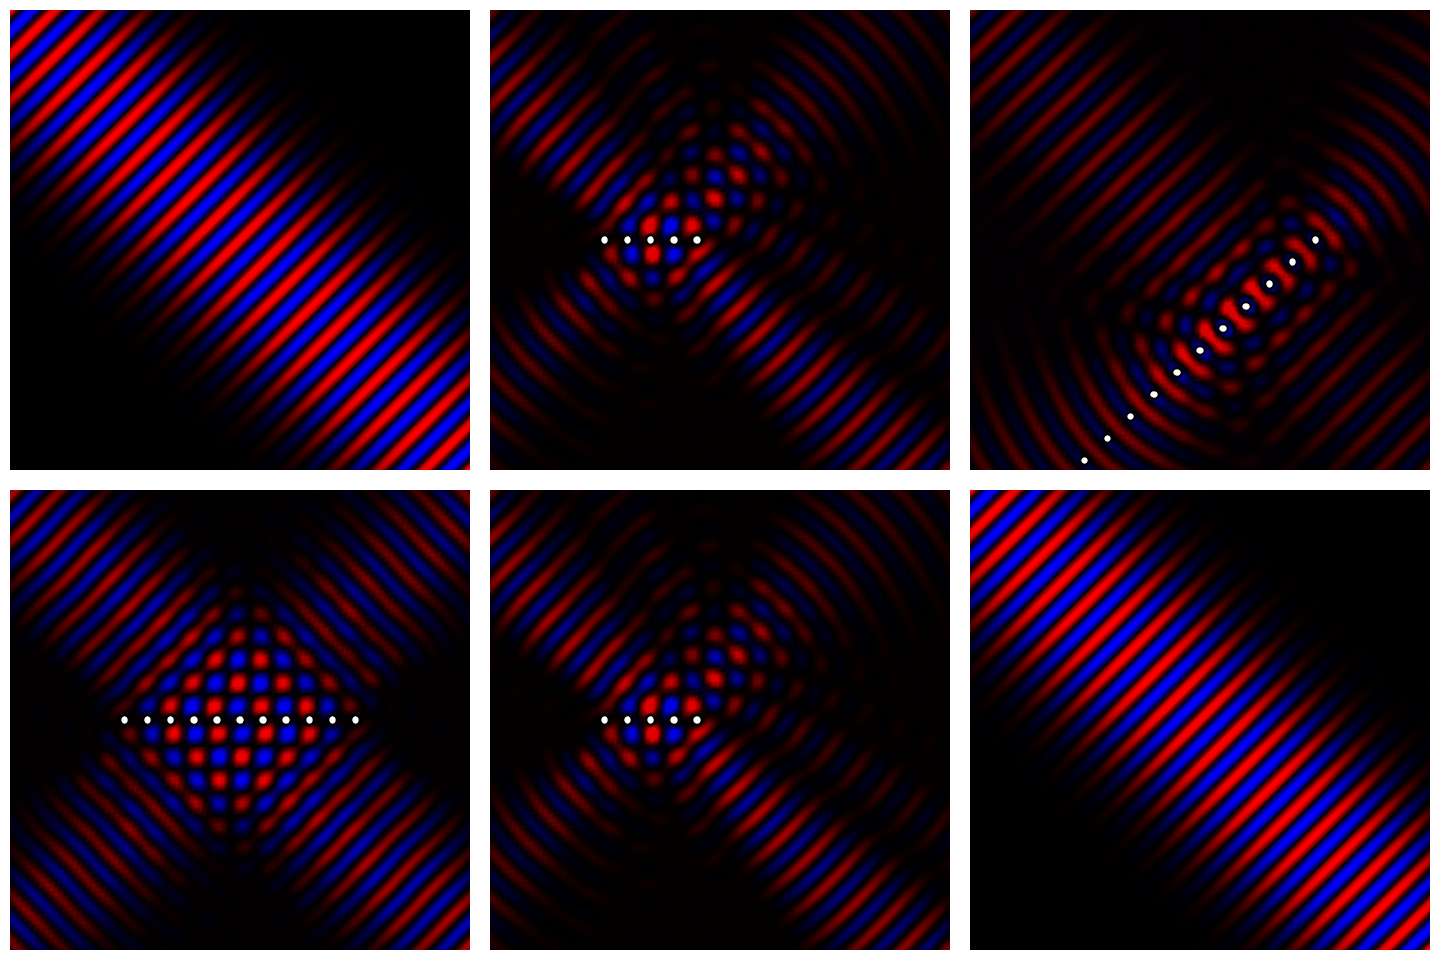
File:Bragg Diffraction.gif
Bragg_Diffraction.gif (480 × 480 pixels, file size: 13.34 MB, MIME type: image/gif, looped, 120 frames, 12 s)
Note: Due to technical limitations, thumbnails of high resolution GIF images such as this one will not be animated.
This file is from a shared repository and may be used by other projects. The description on its file description page there is shown below.
Summary
| DescriptionBragg Diffraction.gif |
English: A line of point scatterers behave approximately as a partial mirror. When the scatterers are arranged in a crystal, each line will reflect light, and all of those reflections will interfere with each other.
(Animation made for scalar fields in 2D) |
| Date | |
| Source | https://twitter.com/j_bertolotti/status/1261314633673080835 |
| Author | Jacopo Bertolotti |
| Permission (Reusing this file) |
https://twitter.com/j_bertolotti/status/1030470604418428929 |
Mathematica 12.0 code
sinstep[t_] := Sin[\[Pi]/2 t]^2
stopstep[t_] := t (2 - t);
\[Lambda] = Sqrt[2];
k0 = (2 \[Pi])/\[Lambda];
c = 1;
\[Omega] = c k0;
\[Alpha] = 4/(k0^2 I);
\[Sigma] = (k0^3 Norm[\[Alpha]]^2)/4;
G[r_] := N[I/4 HankelH1[0, k0 Norm[r] ]];
ReMapC[x_] := RGBColor[(Cos[2 \[Pi] x] + 1)/2 UnitStep[x - 0.5], 0, (Cos[2 \[Pi] x] + 1)/2 UnitStep[0.5 - x]];
\[Theta] = -\[Pi]/4;
E0[x_, y_] := E^(I k0 (Cos[\[Theta]] x + Sin[\[Theta]] y))/4 E^(-((-Sin[\[Theta]] x + Cos[\[Theta]] y)^2/(2 3^2)));

p0 = Table[
   sources = {stopstep[t] ({-5, 0} - {11, 0}) + {11, 0}};
   nsources = Dimensions[sources][[1]];
   DensityPlot[
    Re[E0[x, y]/4 + Sum[G[{x, y} - sources[[j]]] E0[sources[[j, 1]], sources[[j, 2]] ], {j, 1, nsources}] ], {x, -10, 10}, {y, -10, 10}, PlotPoints -> 100, ColorFunction -> ReMapC, Frame -> False, PlotRange -> {-0.5, 0.5}, RegionFunction -> Function[{x, y}, And @@ Table[Norm[{x, y} - sources[[j]]] > 0.2, {j, 1, nsources}]  ], Epilog -> { Black, Thick, Table[Circle[sources[[j]], 0.2], {j, 1, nsources}]}]
   , {t, 0, 1, 0.05}];

p1 = Table[
   sources = Table[{j, 0}, {j, -5, k, 1}];
   nsources = Dimensions[sources][[1]];
   DensityPlot[
    Re[E0[x, y]/10 + Sum[G[{x, y} - sources[[j]]] E0[sources[[j, 1]], sources[[j, 2]] ], {j, 1, nsources}] ], {x, -10, 10}, {y, -10, 10}, PlotPoints -> 100, ColorFunction -> ReMapC, Frame -> False, PlotRange -> {-0.5, 0.5}, RegionFunction -> Function[{x, y}, And @@ Table[Norm[{x, y} - sources[[j]]] > 0.2, {j, 1, nsources}]  ], Epilog -> {White, Table[Disk[sources[[j]], 0.2], {j, 1, nsources}], Black, Thick,
      Table[Circle[sources[[j]], 0.2], {j, 1, nsources}]}]
   , {k, -4, 5, 1}];

p2 = Table[
   sources =
    sinstep[t]*(Table[{j, j - 5}, {j, -5, 5, 1}] - Table[{j, 0}, {j, -5, 5, 1}]) + Table[{j, 0}, {j, -5, 5, 1}];
   nsources = Dimensions[sources][[1]];
   DensityPlot[
    Re[E0[x, y]/10 + Sum[G[{x, y} - sources[[j]]] E0[sources[[j, 1]], sources[[j, 2]] ], {j, 1, nsources}] ], {x, -10, 10}, {y, -10, 10}, PlotPoints -> 100, ColorFunction -> ReMapC, Frame -> False, PlotRange -> {-0.5, 0.5}, RegionFunction -> Function[{x, y}, And @@ Table[ Norm[{x, y} - sources[[j]]] > 0.2, {j, 1, nsources}]  ], Epilog -> {White, Table[Disk[sources[[j]], 0.2], {j, 1, nsources}], Black, Thick,
      Table[Circle[sources[[j]], 0.2], {j, 1, nsources}]}]
   , {t, 0, 1, 0.051}];

p3 = Table[
   sources = Flatten[Table[{x, y} , {x, -5, 5, 1}, {y, 0, -k, -1}], 1];
   nsources = Dimensions[sources][[1]];
   DensityPlot[
    Re[E0[x, y]/10 + Sum[G[{x, y} - sources[[j]]] E0[sources[[j, 1]], sources[[j, 2]] ], {j, 1, nsources}] ], {x, -10, 10}, {y, -10, 10}, PlotPoints -> 100, ColorFunction -> ReMapC, Frame -> False, PlotRange -> {-0.5, 0.5}, RegionFunction -> Function[{x, y}, And @@ Table[Norm[{x, y} - sources[[j]]] > 0.2, {j, 1, nsources}]  ], Epilog -> {White, Table[Disk[sources[[j]], 0.2], {j, 1, nsources}], Black, Thick,
      Table[Circle[sources[[j]], 0.2], {j, 1, nsources}]}]
   , {k, 0, 3, 1}];

ListAnimate[Join[p0, p1, p2, Reverse[p2], p3, Table[p3[[-1]], {10}] , Reverse[p3], Reverse[p1], Reverse[p0] ] ]
Licensing
| This file is made available under the Creative Commons CC0 1.0 Universal Public Domain Dedication. | |
| The person who associated a work with this deed has dedicated the work to the public domain by waiving all of their rights to the work worldwide under copyright law, including all related and neighboring rights, to the extent allowed by law. You can copy, modify, distribute and perform the work, even for commercial purposes, all without asking permission.
http://creativecommons.org/publicdomain/zero/1.0/deed.enCC0Creative Commons Zero, Public Domain Dedicationfalsefalse |
Captions
Items portrayed in this file
depicts
some value
15 May 2020
image/gif
03116ede2036c6bc9df2609544b4a179a44b68ee
13,990,054 byte
11.999999999999973 second
480 pixel
480 pixel
File history
Click on a date/time to view the file as it appeared at that time.
| Date/Time | Thumbnail | Dimensions | User | Comment | |
|---|---|---|---|---|---|
| current | 05:37, 16 May 2020 |  | 480 × 480 (13.34 MB) | imagescommonswiki>Berto | Uploaded own work with UploadWizard |
File usage
The following file is a duplicate of this file (more details):
- File:Bragg Diffraction.gif from Wikimedia Commons
The following page uses this file:
Metadata
This file contains additional information, probably added from the digital camera or scanner used to create or digitize it.
If the file has been modified from its original state, some details may not fully reflect the modified file.
| GIF file comment | Created with the Wolfram Language : www.wolfram.com |
|---|

