English: Christmas Price Index (CPI):
1984-1987: Gradual increase, with a significant jump of 7.36% in 1987.
1987-1989: Slight decrease in 1988, followed by a rise in 1989.
1990-1994: Steady growth with modest annual increases.
1995: Major decrease of -21.72%, a substantial drop.
1996-2001: Recovery and growth, with 2001 featuring a 3.54% increase.
2002: Another sharp decline of -7.56%.
2003-2008: A period of growth, with a notable spike in 2008 of 8.06%.
2009-2010: A slight increase followed by a significant rise of 9.20% in 2010.
2011-2013: Continued growth, with 2013 showing a 7.70% increase.
2014-2017: Slower growth with small yearly increments.
2018: A substantial rise of 11.2%.
2019: Very slight increase of 0.17%.
2020[A]: A dramatic decrease of -58.5%.
2021: A significant recovery with an increase of 5.7% (notably 64.6% from the previous year).
2022-2023: Continued growth with 2022 having a 10.5% increase and 2023 having a 2.7% increase.
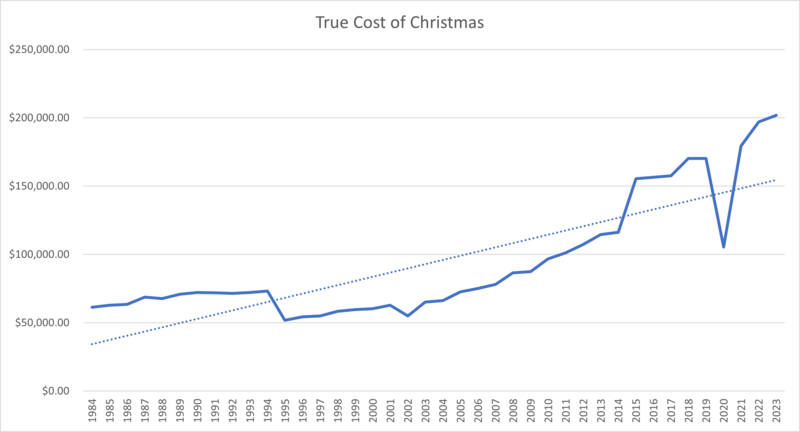
True Cost of Christmas:
1984-1994: General upward trend with fluctuations, peaking in 1994.
1995: A sharp fall to $51,764.94.
1996-2001: Rebound and growth, peaking in 2001 at $62,935.17.
2002: A decrease to $54,951.31.
2003-2008: Consistent increase, with the highest jump to $86,608.51 in 2008.
2009-2010: Slight increase followed by a significant jump in 2010 to $96,824.29.
2011-2013: Steady increase, reaching $114,651.18 in 2013.
2014-2017: Incremental growth, with a slight annual increase.
2018: Major increase to $170,362.26.
2019: A minor decrease to $170,298.03.
2020[A]: A significant drop to $105,561.80.
2021: A large increase to $179,454.19.
2022-2023: Growth continues, with 2023 reaching $201,972.66.
From this analysis, we can see that the general trend for both the CPI and the True Cost of Christmas is upward over the long term, despite some years of decline or modest growth. The most dramatic changes are the decrease in 1995 and 2020, and the strong recoveries in the following years. It's also noteworthy that the increases from 2018 onwards are substantial, indicating rising costs associated with the holiday season.


