Nassi–Shneiderman diagram
A Nassi–Shneiderman diagram (NSD) in computer programming is a graphical design representation for structured programming.[1] This type of diagram was developed in 1972 by Isaac Nassi and Ben Shneiderman who were both graduate students at Stony Brook University.[2] These diagrams are also called structograms,[3] as they show a program's structures.
Overview
Following a top-down design, the problem at hand is reduced into smaller and smaller subproblems, until only simple statements and control flow constructs remain. Nassi–Shneiderman diagrams reflect this top-down decomposition in a straightforward way, using nested boxes to represent subproblems. Consistent with the philosophy of structured programming, Nassi–Shneiderman diagrams have no representation for a GOTO statement.
Nassi–Shneiderman diagrams are only rarely used for formal programming. Their abstraction level is close to structured program code and modifications require the whole diagram to be redrawn, but graphic editors removed that limitation. They clarify algorithms and high-level designs, which make them useful in teaching. They were included in Microsoft Visio and dozens of other software tools, such as the German EasyCODE.[4]
In Germany, Nassi–Shneiderman diagrams were standardised in 1985 as DIN 66261.[5] They are still used in German introductions to programming, for example Böttcher and Kneißl's introduction to C,[6] Baeumle-Courth and Schmidt's introduction to C[7] and Kirch's introduction to C#.[8]
Nassi–Shneiderman diagrams can also be used in technical writing.[9]
Diagrams
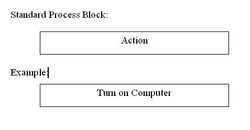
Process blocks: the process block represents the simplest of steps and requires no analysis. When a process block is encountered, the action inside the block is performed and we move onto the next block.
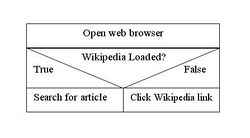
Branching blocks: there are two types of branching blocks. First is the simple True/False or Yes/No branching block which offers the program two paths to take depending on whether or not a condition has been fulfilled. These blocks can be used as a looping procedure stopping the program from continuing until a condition has been fulfilled.
The second type of branching block is a multiple branching block. This block is used when a select case is needed in a program. The block usually contains a question or select case. The block provides the program with an array of choices and is often used in conjunction with sub process blocks to save space.
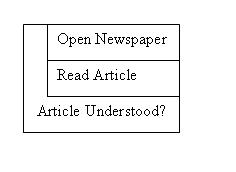
Testing loops: this block allows the program to loop one or a set of processes until a particular condition is fulfilled. The process blocks covered by each loop are subset with a side-bar extending out from the condition.
There are two main types of testing loops, test first and test last blocks. The only difference between the two is the order in which the steps involved are completed. In the test first situation, when the program encounters the block it tests to see if the condition is fulfilled, then, if it is not completes the process blocks and then loops back. The test is performed again and, if the condition is still unfulfilled, it processes again. If at any stage the condition is fulfilled the program skips the process blocks and continues onto the next block.
The test last block is simply reversed, the process blocks are completed before the test is performed. The test last loop allows for the process blocks to be performed at least once before the first test.
Parallel execution can be drawn like this:
See also
Publications
- Nassi, I.; Shneiderman, B.: Flowchart techniques for structured programming, SIGPLAN Notices XII, August 1973.
References
- ↑ Hans-Georg Fill (2009). Visualisation for Semantic Information Systems. p.32
- ↑ A short history of structured flowcharts (Nassi-Shneiderman Diagrams). Webdoc draft: May 27, 2003. (Source)
- ↑ Rolf Isermann (1988). Automatic Control: Selected papers from the triennial world congress of the International Federation of Automatic Control : Munich, Federal Republic of Germany, 27–31 July 1987, Volume 10;Volume 14. p.89
- ↑ "Implementation with structure diagrams". EASYCODE GmbH. http://www.easycode.de/products/easycode-cc/structure-diagrams.html.
- ↑ Deutsches Institut für Normung e. V. (DIN): DIN 66261: Informationsverarbeitung; Sinnbilder für Struktogramme nach Nassi-Shneiderman.
- ↑ Böttcher, Axel; Kneißl, Franz: Informatik für Ingenieure: Grundlagen und Programmierung in C. 3rd edition. München: Oldenbourg, 2012. ISBN:978-3-486-70527-0. See especially Chapter 10: "Kontrollstrukturen" (control flow).
- ↑ Baeumle-Courth, Peter; Schmidt, Torsten: Praktische Einführung in C. München: Oldenbourg, 2012. ISBN:978-3-486-70799-1. See especially Chapter 6: "Kontrollstrukturen" (control flow).
- ↑ Kirch, Ulla: C# lernen und professionell anwenden. Heidelberg: mitp, 2009. ISBN:978-3-8266-5915-7. See especially Chapter 5: "Schleifen und Verzweigungen" (loops and branches).
- ↑ Weiss, Edmond H.: "Visualizing a Procedure with Nassi-Schneiderman Charts", Journal of Technical Writing and Communication, Vol. 20, Nr. 3 (1990): 237-54.
External links
- A short history of structured flowcharts (Nassi–Shneiderman Diagrams), by Ben Shneiderman, draft, 27 May 2003.
- Nicholas Hebb: "How to Create a Nassi-Shneiderman Diagram in Excel" (no date).
- Jülich Supercomputing Centre (JSC): "Generation of Nassi-Shneiderman Diagrams under Unix with nassi", 30 October 2012.
- Yoder, Cornelia M; Schrag, Marilyn L.: "Nassi-Shneiderman Charts: An Alternative to Flowcharts for Design". Proceedings, ACM SIGSOFT/BIGMETRICS Software and Assurance Workshop, November 1978.
 |


