Biology:Demographics of Pristina
| Pristina | ||||
| Areas | Population 2012 census[2] |
Area |
Density | |
| City of Pristina (Kosovo Agency of Statistics) |
205,133 | 854 km2 (330 sq mi) | 230/km2 (600/sq mi)| | |
| Urban (KAS) |
161,751 | Not available | 247/km2 (640/sq mi) | |
| Rural (KAS) |
37,460 | Not available | 123/km2 (320/sq mi) | |
As of December 2012 Pristina, the capital city of Kosovo, had a population of 205,133 registered inhabitants[2]
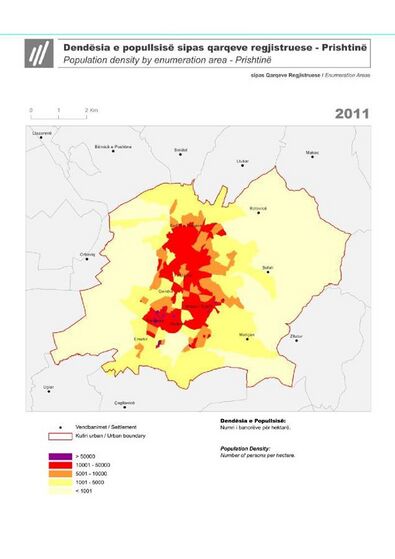
The Rural Part of the municipality as well as the area near the center of Pristina, in terms of socio-economic processes is under the influence of population dynamics, both in terms of demographic regime, which is more expansive, and in addition mechanical population. This part of the municipality has a high density of population. According to some new data, the density of population in the municipality of Pristina is 247 inhabitants per km²[3] While the population density of suburban area of the municipality without Pristina, as an urban center, is 123 inhabitants per km²[4] Pristina as an urban center with representative functions and its economic strength, has changed the population structure. Pristina with the surrounding space has become increasingly a concentration to a large population. While the mountain area, especially more distant areas have a displacement due to depopulation, especially after the recent war. The network of settlements on the territory of the Municipality of Pristina has some specifics. Such as distribution of settlements depends on the degree of economic development, natural conditions, socio-political circumstances, position. One of the features is also uneven distribution of the settlements.
Historical
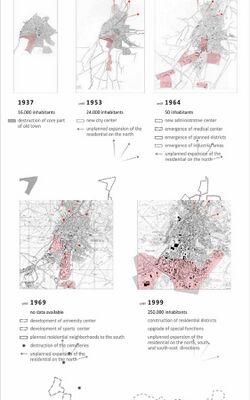
The history of the city was written by the stories of visitors, traders and different invaders of the country, according to which Pristina was built and destroyed many times by different conflicts that took place throughout the history. The oldest writings found place Pristina as a populated area in the middle of the 9th century. It lays 7 km (4 mi) north from the historical location of the Roman city Ulpiana which was destroyed in the coming years, fueling the development of Pristina as a new centrality. During the 14th century, the city became an important trade center due to the crossroad of some of the main arteries linking different parts of the region. In a very short time the city became an important meeting point of many different markets, especially Genoa, Verona, Mantua and Florence led by the colony created by the traders coming from Ragusa (today Dubrovnik).[5]
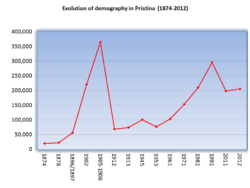
Population statistics for Pristina start with the first census of 1874 when the region of Pristina had 1,567 houses, 258 villages and 19,260 inhabitants, 13,435 of whom were Muslims and 5,825 were Christians.[6]
Based on the time of the Ottoman Empire, Pristina with the surroundings in 1878 had a total of 22,470 inhabitants of whom 16,462 Muslims, 4,686 Christian, 1,272 Gypsies and 50 Jews.[7] In 1896/1897 Kaza of Pristina had 56,286 inhabitants whom 21,462 inhabitants were males and 19,099 were females, respectively 40,561 Muslims, 5,907 males and 5,279 females, respectively 11,186 Christians; 1,305 males, 890 females respectively 2,195 Muslim Gypsies, 446 male, 265 female respectively Christian Gypsies; 869 males, 764 females respectively 1,6333 Latino Catholics - mostly Albanians. [8]
At this time the Kaza of Pristina had 241 villages. Except Ottoman Empire for the statistics and the number of population in Sandžak of Pristina has wrote also the Bulgarian author Marenini. According to him, the number of population in the Sandžak triple and so this sanjak had 118,500 Albanians, 32,500 Serbs and 2,200 Jews or Circassian and total 175,500 inhabitants.[9]
Pristina according to Branislav Nušić consul, in 1902 Sandzak of Pristina had 220,000 inhabitants, of whom 2/3 were with Muslim religion. Others were Catholic and Serbs. Muslims and Catholics were all Albanians. Sandzak of Pristina consisted from 5 Kaza (Pristina, Gnjilane, Presevo, Vushtri, Mitrovica), with a total of 860 villages. Only Kaza of Pristina had 241 villages with 60.993 inhabitants, all of the Muslim religion.[10]
Regarding the number of inhabitants, in 1905–1906 the territory of the municipality of Pristina belonged to Sandzak of Pristina and had 364.015 inhabitants, of whom 254.606 Albanian Muslims, 110.310 Albanian Catholics, Albanian Orthodoxs, Serbs, Romans also Bulgarians. While Pristina in the beginning of First Balkan War, according to the latest statistics from the Ottoman Empire had a total of 68.729 inhabitants of which 63.968 Albanians,3,093 Serbs, 547 Jews and 1,121 Romans.[11]
District of Pristina
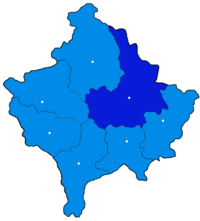
 Pristina District within Kosovo. | |
| Capital | Pristina |
In autumn 1912, Kosovo was occupied by Serbian and Montenegro army. Began the wave of violence and terror, killings of Albanian population in this area. Many people of the territory of Pristina have been forced to flee their homeland and settle mainly in Turkey, while some in Albania, Syria. In order to rule more easily began administrative-territorial division of the Albanian and Kosovo territories. According to documents found in the archives of the Federal Secretariat of Foreign Affairs in Belgrade, PO Fund (Politçko Odelenje) from the consulate general there are some data for the deportation of Albanians from Kosovo in Thessaloniki in Turkey. According to the document 1246 drawn on April 12, 1914, in Turkey alone, 239,807 people were displaced. Note that 239,807 figure does not take children who were under age 6. Also noted in these documents, that have also passed through Kavala 4 thousand Muslim families. All these persons are said to have led Turkey with 395 European boats.[12]
According to a 1913 British document titled "Repartion de la Population Generale des Villes non compromises dans l'etat ALBANIAS lors de la delimitation de 1913, et pourcentage des proportions" said that in the District of Pristina were 63.968 Albanian inhabitants, 8.093 Serbs, 547 Jewish, 1,121 Romans, total 73.737 inhabitants.[13]
After the Balkan Wars and the First World War the number of population in the District of Pristina was reduced significantly. In this year the District of Pristina had 91,550 Albanian inhabitants, and 8,349 Serb inhabitants, this means that this region in 1918 had a total of 99,899 inhabitants.[14]
- According to the census of 1953 in the area of Gracanica where was a part of the territory of Pristina was this situation: 12 municipalities, 56 settlements with many neighborhoods in the context of the settlement, 6,734 families with 45,641 inhabitants. According to some data processed later in 94 settlements of Pristina were 13,389 households with 76,477 inhabitants.
- According to the 1961 census, the municipality of Pristina had 94 settlements with 19,178 households with 102,516 inhabitants (57,417 or 56% Albanians, 34,731 or 33.9% Serbs, 4,140 or 4% Montenegrins, 3,584 or 3.5% Turks)
- According to the 1971 census, the municipality of Pristina had 92 settlements with 28,003 households with 152,744 inhabitants (91,801 or 60.1% Albanians, 42,820 or 28% Serbs, 5,686 or 3.7% Montenegrins, 2,204 or 1.5% Turks)
- According to the 1981 census, the municipality of Pristina had 92 settlements with 36,254 households with 210,044 inhabitants (140,043 or 66.7% Albanians, 43,875 or 20,9% Serbs, 6,394 or 3% Montenegrins, 21% or 4,034 Muslims, 1,974 or 1.5% Turks)[15]
- According to the 1991 Serbian census and estimates, Pristina Municipality had 295,093 inhabitants of which 161,314 or 78.7% Albanians, 27,293 or 13.3% Serbs, 3,888 or 1.9% Montenegrins, 202 or 1% Turks, or 6,626 3.2% Romans.[16]
Results of the 2011 census
Population by sex and ethnicity
| Pristina | Total | Ethnicity (2011 Census) | ||||||||||
|---|---|---|---|---|---|---|---|---|---|---|---|---|
| Albanian | Turks | Ashkali | Serbs | Bosnian | Gorani | Rom | Egyptian | Others | Prefer not
to Answer |
Not Available | ||
| Total[17] | 198,897 | 194,452 | 2,156 | 557 | 430 | 400 | 205 | 56 | 8 | 334 | 79 | 220 |
| Male | 99,361 | 97,347 | 1,060 | 281 | 204 | 107 | 99 | 31 | 3 | 110 | 37 | 82 |
| Female | 99,536 | 97,105 | 1,096 | 276 | 226 | 293 | 106 | 25 | 5 | 224 | 42 | 138 |
Population by sex and religion
| Pristina | Total | Religion | ||||||||||
|---|---|---|---|---|---|---|---|---|---|---|---|---|
| Islamic | Orthodox | Catholic | Other | No Religion | Prefer not
to answer |
Not Available | ||||||
| Total[17] | 198,897 | 193,474 | 480 | 1,170 | 344 | 660 | 2,388 | 381 | ||||
| Male | 99,361 | 96,375 | 221 | 558 | 181 | 334 | 1,168 | 164 | ||||
| Female | 99,536 | 96,739 | 259 | 612 | 163 | 326 | 1,220 | 217 | ||||
Population by sex and citizenship
| Pristina | Total | Country of citizenship | ||||||||||
|---|---|---|---|---|---|---|---|---|---|---|---|---|
| Kosovo | Serbia | Albania | Macedonians | Montenegro | Turkey | Germany | United States | Bosnia and Herzegovina | Croatia | Other Country | ||
| Total[17] | 198,897 | 196,155 | 609 | 147 | 131 | 28 | 162 | 58 | 48 | 19 | 10 | 1,530 |
| Male | 99,361 | 98,019 | 308 | 57 | 62 | 13 | 94 | 25 | 28 | 3 | 3 | 749 |
| Female | 99,536 | 98,136 | 301 | 90 | 69 | 15 | 68 | 33 | 20 | 16 | 7 | 781 |
Population by type of sex and basic contingents
| Pristina | Population | Infants
0 Age |
Children
1-7 Age |
Children
7-14 Age |
Youth
15-27 Age |
Working age population
15-64 Age |
65+ Age | ||||
|---|---|---|---|---|---|---|---|---|---|---|---|
| Total | Male | Female | Total | Male | Female | ||||||
| Total[17] | 198,897 | 99,361 | 99,536 | 3,529 | 19,727 | 28,147 | 45,793 | 134,336 | 66,111 | 68,225 | 13,158 |
| Urban | 161,751 | 80,419 | 81,332 | 2,820 | 15,666 | 22,248 | 37,032 | 110,099 | 53,837 | 56,262 | 10,918 |
| Rural | 37,46 | 18,942 | 18,204 | 709 | 4,061 | 5,899 | 8,761 | 24,237 | 12,274 | 11,963 | 2,240 |
Population by sex and age-groups
| Pristina | Total | Age-Group | ||||||||||||||||
|---|---|---|---|---|---|---|---|---|---|---|---|---|---|---|---|---|---|---|
| 0-4 | 5-9 | 10-14 | 15-19 | 20-24 | 25-29 | 30-34 | 35-39 | 40-44 | 45-49 | 50-54 | 55-59 | 60-64 | 65-59 | 70-74 | 75-79 | 80+ | ||
| Total[17] | 198,897 | 16,754 | 16,781 | 17,868 | 17,427 | 17,708 | 17,749 | 16,436 | 14,765 | 12,601 | 11,411 | 10,350 | 8,872 | 7,017 | 5,460 | 3,771 | 2,267 | 1,660 |
| Male | 99,361 | 8,636 | 8,747 | 9,414 | 9,014 | 8,899 | 8,678 | 7,905 | 7,153 | 6,075 | 5,573 | 5,001 | 4,325 | 3,488 | 2,764 | 1,901 | 1,063 | 725 |
| Female | 99,536 | 8,118 | 8,034 | 84,54 | 8,413 | 8,809 | 9,071 | 8,531 | 7,612 | 6,526 | 5,838 | 5,349 | 4,547 | 3,529 | 2,696 | 1,870 | 1,204 | 935 |
Population by sex and marital status
| Pristina | Marital Status | |||||
|---|---|---|---|---|---|---|
| Total | Never
Married |
Married
with marriage Certificate |
Married
without marriage Certificate |
Widowed | Divorced | |
| Total[17] | 198,897 | 97,897 | 83,586 | 9,833 | 6,664 | 917 |
| Male | 99,361 | 51,776 | 41,372 | 47,227 | 1,216 | 270 |
| Female | 99,536 | 46,121 | 42,214 | 5,106 | 5,448 | 647 |
Population by age 10+ by highest completed education level and sex
| Pristina | Total | Highest completed education level | ||||||||||
|---|---|---|---|---|---|---|---|---|---|---|---|---|
| No completed education | 4 classes | 5 classes | 8 classes | 9 classes | 12 classes | 13 classes | High
School |
Faculty
Bachelor |
Post-graduate
Degree |
Doctorate/PHD | ||
| Total[17] | 165,362 | 12,416 | 6,775 | 14,466 | 23,382 | 14,792 | 47,197 | 15,485 | 4,747 | 21,671 | 3,612 | 819 |
| Male | 81,978 | 4,351 | 1,550 | 7,546 | 8,218 | 7,784 | 27,595 | 7,966 | 2,731 | 11,450 | 2,125 | 662 |
| Female | 83,384 | 8,065 | 5,225 | 6,920 | 15,164 | 7,008 | 19,602 | 7,519 | 2,016 | 10,221 | 1,487 | 157 |
Population by type of settlement, gender and ethnicity 2011
| Settlement, type of
area |
Total[18] | Sex | Ethnicity | |||||||||||
|---|---|---|---|---|---|---|---|---|---|---|---|---|---|---|
| Male | Female | Albanian | Serbian | Turkish | Bosnian | Roman | Ashkali | Egyptian | Gorani | Others | Prefer not
to answer |
Not available | ||
| Ballaban | 167 | 86 | 81 | 167 | - | - | - | - | - | - | - | - | - | - |
| Barilevë | 2,212 | 1,088 | 1,124 | 2,210 | 1 | - | - | - | - | - | - | 1 | - | - |
| Bërnicë e Epërme | 1,595 | 802 | 793 | 1,580 | 11 | - | - | - | - | - | - | 2 | - | 2 |
| Bërnicë e Poshtme | 549 | 288 | 261 | 301 | 245 | - | - | - | - | - | - | - | - | 3 |
| Besi | 694 | 341 | 353 | 694 | - | - | - | - | - | - | - | - | - | - |
| Busi | 814 | 409 | 405 | 814 | - | - | - | - | - | - | - | - | - | - |
| Çagllavicë | 4,233 | 2,172 | 2,061 | 4,116 | 41 | 35 | 2 | 17 | - | - | - | 5 | 1 | 16 |
| Dabishevc | 108 | 51 | 57 | 107 | 1 | - | - | - | - | - | - | - | - | - |
| Dragoc | 178 | 87 | 91 | 176 | - | - | 1 | - | - | - | - | 1 | - | - |
| Drenoc | 590 | 295 | 295 | 590 | - | - | - | - | - | - | - | - | - | - |
| Gllogovicë | 74 | 40 | 34 | 74 | - | - | - | - | - | - | - | - | - | - |
| Grashticë | 433 | 212 | 221 | 432 | - | - | - | - | - | - | - | - | - | - |
| Hajkobillë | 72 | 38 | 34 | 72 | - | - | - | - | - | - | - | - | - | - |
| Hajvali | 7,391 | 3,786 | 3,605 | 7,339 | 6 | 25 | 3 | - | - | - | - | 16 | - | 2 |
| Keçekollë | 484 | 256 | 228 | 483 | - | - | - | - | - | - | - | 1 | - | - |
| Koliq | 466 | 254 | 212 | 464 | - | - | - | - | - | - | - | 2 | - | - |
| Kolovicë | 2,545 | 1,315 | 1,230 | 2,357 | 1 | 1 | 2 | - | - | 1 | - | 2 | - | 1 |
| Kukavicë | 17 | 8 | 9 | 17 | - | - | - | - | - | - | - | - | - | - |
| Lebanë | 398 | 199 | 199 | 397 | 1 | - | - | - | - | - | - | - | - | - |
| Llukar | 1,579 | 796 | 783 | 1,579 | - | - | - | - | - | - | - | - | - | - |
| Makoc | 997 | 521 | 476 | 997 | - | - | - | - | - | - | - | - | - | - |
| Marec | 432 | 243 | 189 | 432 | - | - | - | - | - | - | - | - | - | - |
| Matiçan | 13,876 | 6,990 | 6,886 | 13,782 | 3 | 42 | 21 | - | - | - | 1 | 13 | 1 | 13 |
| Mramor | 1,073 | 554 | 519 | 1,072 | - | - | - | - | - | - | - | - | 1 | - |
| Nëntë Jugoviq | 2,229 | 1,115 | 1,114 | 2,227 | - | - | - | - | - | - | - | 2 | - | - |
| Nishec | 55 | 29 | 26 | 55 | - | - | - | - | - | - | - | - | - | - |
| Orlloviq | 1,035 | 553 | 482 | 1,035 | - | - | - | - | - | - | - | - | - | - |
| Prapashticë | 240 | 133 | 107 | 240 | - | - | - | - | - | - | - | - | - | - |
| Pristina | 145,149 | 72,037 | 73,112 | 141,307 | 92 | 2,052 | 366 | 39 | 557 | 1 | 204 | 281 | 73 | 177 |
| Prugoc | 2,168 | 1,088 | 1,080 | 2,160 | - | - | - | - | - | 5 | - | - | 1 | 2 |
| Radashecë | 29 | 16 | 13 | 29 | - | - | - | - | - | - | - | - | - | - |
| Rimanishtë | 595 | 296 | 299 | 591 | - | 1 | 2 | - | - | - | - | - | 1 | - |
| Sinidol | 959 | 491 | 468 | 957 | - | - | 1 | - | - | - | - | 1 | - | - |
| Siqevë | 337 | 189 | 148 | 337 | - | - | - | - | - | - | - | - | - | - |
| Slivovë | 257 | 124 | 133 | 229 | 28 | - | - | - | - | - | - | - | - | - |
| Sofali | 1,767 | 901 | 866 | 1,758 | - | - | - | - | - | - | - | 6 | 1 | 2 |
| Sharban | 317 | 161 | 156 | 316 | - | - | - | - | - | - | - | - | - | 1 |
| Shashkoc | 298 | 161 | 137 | 298 | - | - | - | - | - | - | - | - | - | - |
| Teneshdoll | 359 | 176 | 183 | 359 | - | - | - | - | - | - | - | - | - | - |
| Trudë | 694 | 338 | 356 | 693 | - | - | - | - | - | - | - | - | - | 1 |
| Vranidoll | 1,053 | 533 | 520 | 1,051 | - | - | 1 | - | - | 1 | - | - | - | - |
| Zllash | 146 | 65 | 81 | 146 | - | - | - | - | - | - | - | - | - | - |
| Zllatar | 233 | 124 | 109 | 232 | - | - | - | - | - | - | - | 1 | - | - |
References
- ↑ "Atlasi i Regjistrimit te Popullsisë." (in Albanian). Kosovo Agency of Statistics. 31 December 2012. https://esk.rks-gov.net/ENG/publikimet/doc_view/1125-kosovo-census-atlas-?tmpl=component&format=raw.pdf. Retrieved 23 February 2014.
- ↑ 2.0 2.1 "Vleresimi i popullsis 2012." (in Albanian). Kosovo Agency of Statistics. 31 December 2012. https://esk.rks-gov.net/ENG/publikimet/doc_download/1087-estimation-of-kosovo-population-2012.pdf. Retrieved 23 February 2014.
- ↑ "Density of Population." (in Albanian). Agency of State Archives of Kosovo. 3 August 2012. http://ashak.rks-gov.net/#. Retrieved 23 February 2014.
- ↑ Riza Qavolli ,"Gjeografia Regjionale e Kosoves page.157"
- ↑ Population areas during years in Pristina , official web site. Retrieved on 27 February 2014
- ↑ Skender Rizaj, "Shperngulja e Shqiptarëve gjatë shekujve page.51"|
- ↑ Skender Rizaj,"Vilajeti i Kosoves 1878(Rregullimi Politik dhe rrethanat kulturo-arsimore dhe demografike), II-III, 1970, page 240; Izber Hoti Prishtina me Rrethin dhe Gjurmime Albanologjike, XI-1981, page 181"|
- ↑ Kosova Vilayeti Salnamesi,1896, Uskup, Pristina, Prizen, Ipek, Yenipazar, Taslica, Stamboll,2000 page,185.|
- ↑ Skender Rizaj, "Vilajeti i Kosoves 1878(Rregullimi Politik dhe rrethanat kulturo-arsimore dhe demografike), II-III,1970, page 240; Izber Hoti, Prishtina me Rrethinë dhe Gjurmime Albanologjike, XI-1981, page181"|
- ↑ Sami Frasheri, "Vepra 7,"Rilindja", Prishtinë 1984 page 475-476"|
- ↑ Albanian National Archives | Fondi:Mbrojtja Kombëtare e Kosoves, dos.22, dok.708,417;Izber Hoti, Prishtine me rrethinë.... Gjurmime Albanologjike, XI-1981 page.181|
- ↑ Serbian Academy of Sciences and Arts, Section of Historical Sciences | Fondi:Dokumenta o spolnjoj politici kraljevine serbije", K.VII Sv.1 Beograd 1980.page.617-618 |
- ↑ Public Record Office, FO 925/41160 ,Appell de la colonie Albanaise en Turquie aux Grandes Puissances de L'entente, et aux Etats-Unis D'Amerique. Dokumenti:Repartion de la Population Generale des Villes non compromises dans l'etat ALBANIAS lors de la delimitation de 1913
- ↑ Albanian National Archives| Fondi:Mbrojtja Kombëtare e Kosoves, dos.13 dhe 37, dok.708 416 dhe 708 802, ;Izber Hoti, Prishtine me rrethinë.... Gjurmime Albanologjike, XI-1981 page.181
- ↑ "The documents about Registration of population of Pristina for the years 1953,1961,1971, and 1981 are taken from Kosovo Agency of Statistics" (in Albanian). Kosovo Agency of Statistics. https://esk.rks-gov.net/#. Retrieved 23 February 2014.
- ↑ Stanovništvo br. 3-4/1900 and 1-2/1991, Beograd, 1922; Atllas, Dr. Asllan Pushka, Kosova dhe vazhdimësia etnike shqiptare, Prishtinë,1997, page,37.
- ↑ 17.0 17.1 17.2 17.3 17.4 17.5 17.6 "Results of the 2011 census" (in Albanian). 31 March 2012. https://esk.rks-gov.net/rekos2011/repository/docs/Te%20dhenat%20kryesore%20demografike%20sipas%20komunave.pdf. Retrieved 25 August 2014.
- ↑ "Population by type of settlement, gender and ethnicity 2011.". Kosovo Agency of Statistics. 5 March 2011. https://esk.rks-gov.net/rekos2011/repository/docs/Population%20by%20gender,%20ethnicity%20at%20settlement%20level.pdf. Retrieved 23 February 2014.
External links
- "Kosovo Agency of Statistics". esk.rks-gov.net. https://esk.rks-gov.net/eng/. Retrieved 2014-03-02.
- "REKOS2011". esk.rks-gov.net. https://esk.rks-gov.net/rekos2011/?cid=2,1. Retrieved 2014-03-02.
- "dead link". ashak.rks-gov.net. Archived from the original on 2014-03-02. https://web.archive.org/web/20140302173721/http://ashak.rks-gov.net/. Retrieved 2014-03-02.
- "Biblioteka Kombëtare e Shqipërisë". bksh.al. http://www.bksh.al/. Retrieved 2014-03-05.


