Engineering:Brownian noise


In science, Brownian noise, also known as Brown noise or red noise, is the type of signal noise produced by Brownian motion, hence its alternative name of random walk noise. The term "Brown noise" does not come from the color, but after Robert Brown, who documented the erratic motion for multiple types of inanimate particles in water. The term "red noise" comes from the "white noise"/"white light" analogy; red noise is strong in longer wavelengths, similar to the red end of the visible spectrum.
Explanation
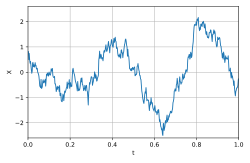
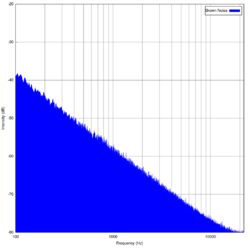
The graphic representation of the sound signal mimics a Brownian pattern. Its spectral density is inversely proportional to f 2, meaning it has higher intensity at lower frequencies, even more so than pink noise. It decreases in intensity by 6 dB per octave (20 dB per decade) and, when heard, has a "damped" or "soft" quality compared to white and pink noise. The sound is a low roar resembling a waterfall or heavy rainfall. See also violet noise, which is a 6 dB increase per octave.
Strictly, Brownian motion has a Gaussian probability distribution, but "red noise" could apply to any signal with the 1/f 2 frequency spectrum.
Power spectrum
A Brownian motion, also called a Wiener process, is obtained as the integral of a white noise signal:
- [math]\displaystyle{ W(t) = \int_0^t \frac{dW(\tau)}{d\tau} d\tau }[/math]
meaning that Brownian motion is the integral of the white noise [math]\displaystyle{ dW(t) }[/math], whose power spectral density is flat:[1]
- [math]\displaystyle{ S_0 = \left|\mathcal{F}\left[\frac{dW(t)}{dt}\right](\omega)\right|^2 = \text{const}. }[/math]
Note that here [math]\displaystyle{ \mathcal{F} }[/math] denotes the Fourier transform, and [math]\displaystyle{ S_0 }[/math] is a constant. An important property of this transform is that the derivative of any distribution transforms as[2]
- [math]\displaystyle{ \mathcal{F}\left[\frac{dW(t)}{dt}\right](\omega) = i \omega \mathcal{F}[W(t)](\omega), }[/math]
from which we can conclude that the power spectrum of Brownian noise is
- [math]\displaystyle{ S(\omega) = \big|\mathcal{F}[W(t)](\omega)\big|^2 = \frac{S_0}{\omega^2}. }[/math]
An individual Brownian motion trajectory presents a spectrum [math]\displaystyle{ S(\omega)=S_0/\omega^2 }[/math], where the amplitude [math]\displaystyle{ S_0 }[/math] is a random variable, even in the limit of an infinitely long trajectory.[3]
Production
Brown noise can be produced by integrating white noise.[4][5] That is, whereas (digital) white noise can be produced by randomly choosing each sample independently, Brown noise can be produced by adding a random offset to each sample to obtain the next one. As Brownian noise contains infinite spectral power at low frequencies, the signal tends to drift away infinitely from the origin. A leaky integrator might be used in audio or electromagnetic applications to ensure the signal does not “wander off”, that is, exceed the limits of the system's dynamic range. This turns the Brownian noise into Ornstein–Uhlenbeck noise, which has a flat spectrum at lower frequencies, and only becomes “red” above the chosen cutoff frequency.
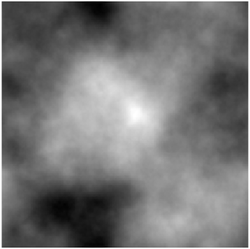
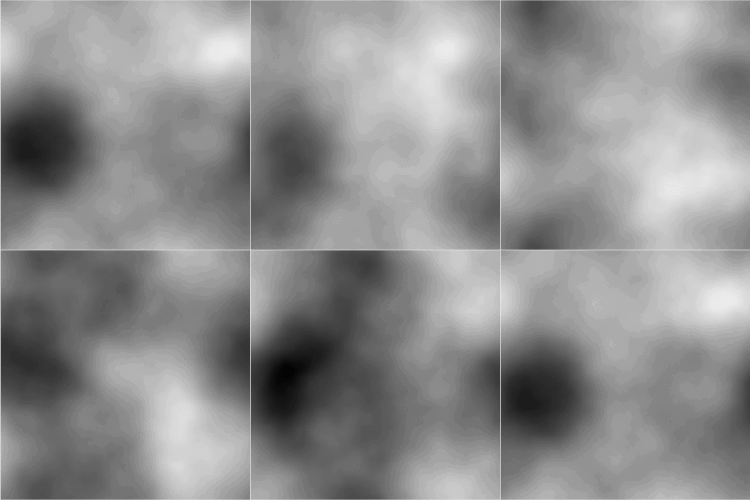
Brownian noise can also be computer-generated by first generating a white noise signal, Fourier-transforming it, then dividing the amplitudes of the different frequency components by the frequency (in one dimension), or by the frequency squared (in two dimensions) etc. [6] Matlab programs are available to generate Brownian and other power-law coloured noise in one or any number of dimensions.
Sample
References
- ↑ Gardiner, C. W.. Handbook of stochastic methods. Berlin: Springer Verlag.
- ↑ Barnes, J. A.; Allan, D. W. (1966). "A statistical model of flicker noise". Proceedings of the IEEE 54 (2): 176–178. doi:10.1109/proc.1966.4630. and references therein
- ↑ Krapf, Diego; Marinari, Enzo; Metzler, Ralf; Oshanin, Gleb; Xu, Xinran; Squarcini, Alessio (2018-02-09). "Power spectral density of a single Brownian trajectory: what one can and cannot learn from it". New Journal of Physics 20 (2): 023029. doi:10.1088/1367-2630/aaa67c. Bibcode: 2018NJPh...20b3029K.
- ↑ "Integral of White noise". 2005. http://www.dsprelated.com/showmessage/46697/1.php.
- ↑ Bourke, Paul (October 1998). "Generating noise with different power spectra laws". http://paulbourke.net/fractals/noise/.
- ↑ Das, Abhranil (2022). Camouflage detection & signal discrimination: theory, methods & experiments (corrected) (PhD). The University of Texas at Austin. doi:10.13140/RG.2.2.32016.07683.
 |


