Medicine:Glasgow effect
The Glasgow effect refers to the lower life expectancy of residents of Glasgow compared to the rest of the United Kingdom and Europe.[1][2] The phenomenon is defined as an "[e]xcess mortality in the West of Scotland (Glasgow) after controlling for deprivation."[3] Although lower income levels are generally associated with poor health and a shorter lifespan, epidemiologists have argued that poverty alone does not appear to account for the disparity found in Glasgow.[2][4][5][6][7][8] Equally deprived areas of the UK such as Liverpool and Manchester have higher life expectancies, and the wealthiest ten percent of the Glasgow population have a lower life expectancy than the same group in other cities.[9] One in four men in Glasgow will die before his sixty-fifth birthday.[10]
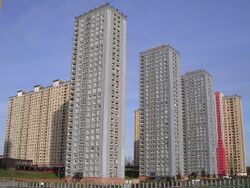
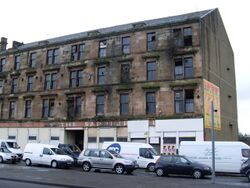
Several hypotheses have been proposed to account for the ill health, including the practice in the 1960s and 1970s of offering young, skilled workers in Glasgow social housing in new towns, leaving behind a demographically "unbalanced population".[11][12] Other suggested factors have included a high prevalence of premature and low birthweight births, land contaminated by toxins, a high level of derelict land, more deindustrialisation than in comparable cities, poor social housing, religious sectarianism, lack of social mobility,[13] vitamin D deficiency, cold winters, higher levels of poverty than the figures suggest, adverse childhood experiences and childhood stress, high levels of stress in general, and social alienation.[14]
Excess mortality and morbidity
The city's mortality gap was not apparent until 1950 and seems to have widened since the 1970s.[9] The Economist wrote in 2012: "It is as if a malign vapour rises from the Clyde at night and settles in the lungs of sleeping Glaswegians."[15]
The mortality rates are the highest in the UK and among the highest in Europe. As of 2016, life expectancy in Scotland was lower for both females and males than anywhere else in western Europe, and was not improving as quickly as in other western European countries.[16] With a population of 1.2 million in greater Glasgow, life expectancy at birth is 71.6 years for men, nearly seven years below the national average of 78.2 years, and 78 years for women, over four years below the national average of 82.3.[14][17][18]
According to the World Health Organization in 2008, the male life expectancy at birth in the Calton area of Glasgow between 1998–2002 was 54 years.[19][lower-alpha 1] A local doctor attributed this to alcohol and drug abuse, and to a violent gang culture.[22] According to Bruce Whyte of the Glasgow Centre for Population Health, writing in 2015, the estimate was based on deaths in 1998–2002 in an area comprising 2,500 people, and the figures may have been affected by the presence of hostels for adults with alcohol, drug and mental-health problems. The 2008–2012 estimate for Calton and nearby Bridgeton together, by then more ethnically diverse and with fewer hostels, was 67.8 years for males and 76.6 years for females.[23]
Research led by David Walsh of the Glasgow Centre for Population Health in 2010 concluded that the deprivation profiles of Glasgow, Liverpool and Manchester are almost identical, but premature deaths in Glasgow are over 30 percent higher, and all deaths around 15 percent higher, across almost the entire population.[9] The higher mortality is fueled by stroke, respiratory disease, cardiovascular disease and cancer, along with deaths caused by alcohol, drugs, violence and suicide.[24] According to a 2016 study, 43 percent of adults are classified as either disabled or chronically ill. Suicide rates are higher than they were in 1968, and the all-cause mortality rate in the 15–44 age group is 142.4 deaths per 100,000.[8] Drug-related deaths in Scotland more than doubled between 2006 and 2016.[25]
Hypotheses
The Glasgow Centre for Population Health (GCPH) was established in 2004 to study the causes of Glasgow's ill health; the centre's partners are NHS Greater Glasgow and Clyde, Glasgow City Council and the University of Glasgow.[26] In a publication introducing the GCPH, the Chief Medical Officer for Scotland, Harry Burns, referred to research suggesting that chronically activated stress responses, especially in children, affect the structure of parts of the frontal lobes of the brain, and that these determine the physical reaction to stress, which could result in chronic ill health. The ability to attain good health, he suggested, depends in part on whether people feel in control of their lives, and whether they see their environments as threatening or supportive.[27]
A GCPH report in 2016 concluded that certain historical processes and policy decisions had left the city more vulnerable to deprivation.[28][29][30][12] Factors include the "lagged effects" of overcrowding and the former practice, in the 1960s and 1970s, of offering young, skilled workers social housing in new towns outside Glasgow; this, according to a 1971 government document, threatened to leave behind an "unbalanced population with a very high proportion of the old, the very poor and the almost unemployable".[31]
Other hypotheses have included a higher prevalence of premature and low-birthweight births;[32] land contaminated by toxins such as chromium;[33] a high level of derelict land, leading to a "negative physical environment";[34] more deindustrialisation than in comparable cities;[35] and low-quality housing estates.[36][12] Social deficits and sources of social dysfunction have been suggested: religious sectarianism;[37] a low "sense of coherence";[38] low social capital;[39] lack of social mobility;[40] and a culture of alienation and pessimism.[14][15] Soft water (with lower levels of magnesium and calcium) has been mentioned as a possible factor,[41] as have cold winters; vitamin D deficiency; higher levels of poverty than the figures suggest; and adverse childhood experiences.[14][15]
See also
- Housing in Glasgow
- Salutogenesis
Notes
References
- ↑ Lewis, Daniel (2017). "Capturing complexity". Health Geographies: A Critical Introduction. Oxford: John Wiley & Sons. p. 158.
- ↑ 2.0 2.1 2.2 Reid, Michael (2011). "Behind the 'Glasgow effect'". Bulletin of the World Health Organization 89 (10): 706–707. doi:10.2471/BLT.11.021011. PMID 22084504. PMC 3209974. https://www.who.int/bulletin/volumes/89/10/11-021011/en/.
- ↑ Friis, Robert H.; Sellers, Thomas (2013). Epidemiology for Public Health Practice. London: Jones & Bartlett Publishers. p. 745.
- ↑ Donnelly, P. D. (2010). "Explaining the Glasgow effect: Could adverse childhood experiences play a role?". Public Health 124 (9): 498–499. doi:10.1016/j.puhe.2010.05.013. PMID 20728908. https://www.publichealthjrnl.com/article/S0033-3506(10)00188-5/abstract?code=puhe-site.
- ↑ Gavine, A. J.; Williams, D. J.; Shearer, M. C.; Donnelly, P. D. (2011). "The Glasgow effect: Useful construct or epidemiological dead end?". Public Health 125 (8): 561–562. doi:10.1016/j.puhe.2011.04.006. PMID 21794886.
- ↑ Fraser, Simon; George, Steve (2015). "Perspectives on differing health outcomes by city: Accounting for Glasgow's excess mortality". Risk Management and Healthcare Policy 8: 99–110. doi:10.2147/RMHP.S68925. PMID 26124684.
- ↑ Hanlon, Phil (2015). "Unhealthy Glasgow: A case for ecological public health?". Public Health 129 (10): 1353–60. doi:10.1016/j.puhe.2015.08.006. PMID 26376607. http://eprints.gla.ac.uk/113101/1/113101.pdf.
- ↑ 8.0 8.1 Cowley, Joe; Kiely, John; Collins, Dave (December 2016). "Unravelling the Glasgow effect: The relationship between accumulative bio-psychosocial stress, stress reactivity and Scotland's health problems". Preventive Medicine Reports 4: 370–375. doi:10.1016/j.pmedr.2016.08.004. PMID 27512652.
- ↑ 9.0 9.1 9.2 Walsh, David; Bendel, Neil; Jones, Richard; Hanlon, Phil (September 2010). It's not 'just deprivation': Why do equally deprived UK cities experience different health outcomes?. Glasgow Centre for Population Health. pp. 1–12. http://www.gcph.co.uk/assets/0000/0801/GCPH_Briefing_Paper_25_for_web.pdf.
Walsh, D.; Bendel, N; Jones, R.; Hanlon, P. (2010). "It's not 'just deprivation': Why do equally deprived UK cities experience different health outcomes?". Public Health 124 (9): 487–495. doi:10.1016/j.puhe.2010.02.006. PMID 20223487. https://www.publichealthjrnl.com/article/S0033-3506(10)00033-8/abstract?code=puhe-site.
- ↑ Ash, Lucy (5 June 2014). "Why is Glasgow the UK's sickest city?". BBC News. https://www.bbc.com/news/magazine-27309446.
- ↑ Walsh, David; McCartney, Gerry; Collins, Chik; Taulbut, Martin; Batty, G. David (May 2016). "History, politics and vulnerability: explaining excess mortality in Scotland and Glasgow". Public Health (Glasgow Centre for Population Health) 151: 209–210. doi:10.1016/j.puhe.2017.05.016. PMID 28697372. http://www.gcph.co.uk/assets/0000/5586/History_politics_and_vulnerability.pdf.
- ↑ 12.0 12.1 12.2 Mackay, Kirsty (26 February 2021). The Glasgow Effect: examining the city's life expectancy gap –a photo essay. The Guardian.
- ↑ Walsh et al. 2016, pp. 218–276.
- ↑ 14.0 14.1 14.2 14.3 Muriel, Ali (6 November 2012). "Mystery of Glasgow's health problems", The Guardian, 6 November 2012.
- ↑ 15.0 15.1 15.2 "Unhealthy Glaswegians: No city for old men", The Economist, 25 August 2012.
- ↑ Walsh et al. 2016, p. 24.
- ↑ "Glasgow has lowest life expectancy in UK", BBC News, 19 October 2011.
- ↑ Reid, James (September 2008). "Excess mortality in the Glasgow conurbation: exploring the existence of a Glasgow effect", PhD thesis, University of Glasgow Faculty of Medicine.
- ↑ for., Europe, WHO Regional Office (2008). Closing the Gap in a Generation : Health Equity through Action on the Social Determinants of Health.. World Health Organization. ISBN 978-92-4-156370-3. OCLC 990409996. http://worldcat.org/oclc/990409996.
- ↑ Closing the gap in a generation: health equity through action on the social determinants of health. Final Report of the Commission on Social Determinants of Health. Geneva: World Health Organization. 2008. p. 32. http://apps.who.int/iris/bitstream/handle/10665/43943/9789241563703_eng.pdf.
- ↑ Hanlon, Phil; Walsh, David; Whyte, Bruce (2006). Let Glasgow Flourish. Glasgow: Glasgow Centre for Population Health. http://www.gcph.co.uk/assets/0000/0377/LetGlasgowFlourish_full.pdf.
- ↑ "GP explains life expectancy gap". BBC News, 28 August 2008; "Male life expectancy at birth". BBC News, 28 August 2008.
- ↑ Whyte, Bruce (2 June 2015). "Life expectancy in Calton—no longer 54". Glasgow Centre for Population Health.
- ↑ Walsh et al. 2016, p. 25.
- ↑ Gayle, Damien (15 August 2017). "Drug-related deaths in Scotland more than double in 10 years". The Guardian. https://www.theguardian.com/uk-news/2017/aug/15/drug-related-deaths-in-scotland-more-than-doubles-in-10-years.
- ↑ Tannahill, Carol (27 October 2004). "Introducing the Glasgow Centre for Population Health". Glasgow Centre for Population Health. p. 5.
- ↑ Burns, Harry (27 October 2004). "How Health is Created: An Hypothesis". Glasgow Centre for Population Health, p. 15.
- ↑ Walsh et al. 2016.
- ↑ Goodwin, Karin (10 June 2016). "The Glasgow effect: 'We die young here – but you just get on with it'". The Guardian. https://www.theguardian.com/cities/2016/jun/10/glasgow-effect-die-young-high-risk-premature-death.
- ↑ "Scottish 'excess' mortality: comparing Glasgow with Liverpool and Manchester" (in en-GB). Glasgow Centre for Population Health. http://www.gcph.co.uk/work_themes/theme_1_understanding_glasgows_health/excess_mortality_comparing_glasgow.
- ↑ Walsh et al. 2016, pp. 209–210.
- ↑ Walsh et al. 2016, pp. 218–223.
- ↑ Walsh et al. 2016, pp. 224–227.
- ↑ Walsh et al. 2016, pp. 228–231.
- ↑ Walsh et al. 2016, pp. 232–237.
- ↑ Walsh et al. 2016, pp. 238–243.
- ↑ Walsh et al. 2016, pp. 244–248.
- ↑ Walsh et al. 2016, pp. 250–252.
- ↑ Walsh et al. 2016, pp. 255–259.
- ↑ Walsh et al. 2016, pp. 262–265.
- ↑ Walsh et al. 2016, pp. 275–276.
Further reading
- Craig, Carol (2010). The Tears that Made the Clyde: Well-being in Glasgow. Argyll: Argyll Publishing.
- Gray, Linsay; Leyland, Alastair H. (2009). "Is the 'Glasgow effect' of cigarette smoking explained by socio-economic status?: A multilevel analysis". BMC Public Health 9: 245. doi:10.1186/1471-2458-9-245. PMID 19615067.
- Levin, K. A. (2012). "Glasgow smiles better: An examination of adolescent mental well-being and the 'Glasgow effect'". Public Health 126 (2): 96–103. doi:10.1016/j.puhe.2011.10.010. PMID 22192383.
- Harrison, Ellie (2016). The Glasgow Effect: A tale of class, capitalism and carbon footprint. Edinburgh: Luath Press.
- McCartney, Gerry; Shipley, Martin; Hart, Carole et al. (2012). "Why Do Males in Scotland Die Younger than Those in England? Evidence from Three Prospective Cohort Studies". PLOS ONE 7 (7): e38860. doi:10.1371/journal.pone.0038860. PMID 22808017. Bibcode: 2012PLoSO...738860M.
- Macdonald, Fleur (16 October 2019). "The 'Glasgow effect' implies cities make us sad. Can the city prove the opposite?". The Guardian.
- McEwen, Bruce S. (7 April 2008). "Central effects of stress hormones in health and disease: understanding the protective and damaging effects of stress and stress mediators". European Journal of Pharmacology 583 (2–3): 174–185. doi:10.1016/j.ejphar.2007.11.071. PMID 18282566.
 |


