Finance:Morris–Putnam point
The Morris–Putnam point (MPP or “Profit Horizon” ) is the point within a break even analysis where an algorithmic trend line indicates break even will be exceeded by n percent. Economists and Financial analysts use the Morris–Putnam point to predict the impact of commodities costs on juice and heavy metals profits. Meteorologists use "The Point" to forecast dew points and localized wind gusts. Sales people use the point to rationalize the addition of ‘fees’ to previously agreed upon prices because when modeled skillfully, the Morris–Putnam point almost always predicts future success.[citation needed]
For example, if a citrus farm produces 25,714 baskets of citrus within the first third of a growing season; and if this growth rate, when plotted daily using an algorithmic trend line, appears to exceed the mid-season break even assumption, then armed with that knowledge the citrus farmer can buy a new picking machine/device in anticipation of a successful harvest. If, on the other hand, the citrus farmer finds that Morris–Putnam point will NOT be achieved, he will likely lobby local political resources for any number of appropriate subsidies.[citation needed]
Computation
Total Time of product availability to date / total anticipated life of product X the total time of product availability (adjusted for daily variations) = MPP[citation needed]
Origin
The Morris–Putnam point was first proposed by the French mathematician Sinclair Du’velle in the modern equivalent of a 17th-century term paper in a graduate level course titled Mathematica De Musica (the Math of Music). Du’velle theorized that the staccato moment in a successful opera could be consistently determined by applying these mathematical principals to the number of notes in any opera divided by the opera's length in seconds.
In 1968, a common law couple, Dr. Adamly Morris, and Dr. Klein Marshal popularized the theory through a series of climate change lectures predicting the second ice age. The apparent soundness of the math fortified the climate change community and several movies were made.[citation needed]
Illustration
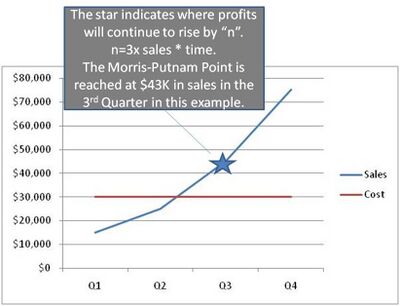
Above is a graphical example of the Morris–Putnam Point. The example illustrates the point at which profit reaches through the barriers of the cost of goods (COGS) at a consistent rate (n). This example shows the MPP actually being reached after profitability is met. This is not always the case and often is met well before even a concept of the product is finalized.[citation needed]
References
External links
- The original critique of Du'velle's theory: http://penelope.uchicago.edu/Thayer/L/Roman/Texts/Isidore/3*.html
- A known plagiarism of Du'velle's theory: http://www.chmtl.indiana.edu/tml/16th/FOLMUS1_TEXT.html


