Finance:International inequality
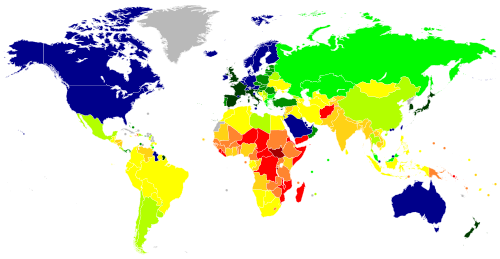
International inequality refers to inequality between countries, as compared to global inequality, which is inequality between people across countries. International inequality research has primarily been concentrated on the rise of international income inequality, but other aspects include educational and health inequality,[1] as well as differences in medical access. Reducing inequality within and among countries is the 10th goal of the UN Sustainable Development Goals and ensuring that no one is left behind is central to achieving them.[2] Inequality can be measured by metrics such as the Gini coefficient.
According to the United Nations Human Development Report 2004, the gross domestic product (GDP) per capita in countries with high, medium and low human development (a classification based on the UN Human Development Index) was 24,806, 4,269 and 1,184 PPP$, respectively (PPP$ = purchasing power parity measured in United States dollar s).[3]
Proposed explanations
Differences in economic institutions
Economic institutions such as competitive markets, credible contracts and systems of property rights allow economic agents to pursue the economic activities which form the basis of growth. It has been argued that the presence or absence of strong economic institutions is a primary determinant of development. Economists have begun to consider the set of economic institutions adopted by countries as a choice that is in turn determined endogenously by competing social forces.
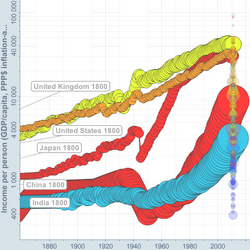
In a widely cited paper by Daron Acemoglu, Simon Johnson and James A. Robinson, the authors concluded that the majority of present-day inequality among former European colonies can be attributed to the persisting role of economic institutions. Describing European colonization as a "natural experiment," they argued that colonizers who encountered dense populations with developed economies such as in Central America and India were incentivized to impose extractive economic institutions, while colonizers who encountered sparse populations with few natural resources such as in North America were more likely to institute broad-based property rights. This resulted in a "reversal of fortune" around 1800 as regions which were under-developed at the time of colonization were able to industrialize more effectively.
Path dependence
In the context of development, path dependence is the idea that certain points in history may have an outsized and persistent impact on the long-term economic and political character of nations. These points may produce outcomes that induce positive feedback and are therefore difficult to reverse. Political scientist James Mahoney has examined the political consequences of a period of liberal reform in Central America during the 19th and early 20th centuries, and argued that whether policies were implemented along radical or reformist guidelines directly determined the success of the liberalization efforts and ultimately resulted in vastly different political outcomes which persisted for decades, ranging from military authoritarian regimes (Guatemala and El Salvador) to progressive democracy (Costa Rica).
Other explanations
Multiple other causes of international inequality have been proposed, such as:
- Geography: The location of countries often affects their economy. For example, landlocked countries have difficulty accessing sea trade routes.[5][6]
- Economic structure: the economies of different countries are composed of different industries, such as poorer countries relying primarily on agriculture.[7]
- The use of the United States dollar in international trade allows the US government to create wealth by creating new money.[8]
- Environmental factors (including work by Jared Diamond)
- Cultural factors (including work by Max Weber)
International inequality during COVID-19
The worsening of inequality is considered the most significant outcome of COVID-19.[9] The pandemic has had the greatest impact on vulnerable groups such as the elderly, people with disabilities, children, women and refugees, low-income people, youth, and informal workers.[10] The research and measures of the World Bank, say that "Covid-19 has increased inequality in nearly every sphere: in the availability of vaccines, in economic growth rates, in access to education and health care, and the scale of job and income losses".[11] Between 2020 and 2021 global billionaire wealth grew by $4.4 trillion but at the same time, more than 100 million people fell below the poverty line.[9]
Impact on the labor market
COVID-19 caused the change of view in providing certain activities, goods and services, and certain production processes. They are considered to be riskier and costlier. Staff shortages and breaks of working activity because of compulsory quarantines of Covid-positive workers are the reason for the replacement of the human labor force with robots. Robots are easily managed, don't need masks, can be easily disinfected, and don't get sick.[12] The threat of automation has spread to the work of low-skilled, person-to-person service workers. Before the pandemic, these jobs were seen by literature as less affected – for example, in health and education. New labor market uncertainty brings a decrease in the demand for certain types of labor. This shift consequently causes an increase in inequality.[13] Another inequality was visible after the beginning of lockdowns. Millions of newly unemployed joined the long queues for social security benefits.[14] The loss of jobs differs by the nature of the job. Tourism, gastronomy, recreational services and accommodation, airlines, and industries that rely on personal interactions have been the hardest hit.[15] Lockdown rules and social distance requirements limited employees. The inability of workers to work from home deprived a lot of them of their jobs.
Inequality in access to healthcare
COVID-19 is the biggest health crisis in a century. Not only were poor countries with weak health care systems hard-hit, but also economically strong and developed rich countries. America is considered the most hit country in a term of unequal access to resources and health services.[16] One of the reasons for their highest number of cases and deaths is their worst average healthcare standards among the major developed economies.[13] The poorest suffer from the lack of a universal healthcare system and high prices of medicaments (and for health care, in general) the most. Many Americans skipped testing to know if they are infected because of the high price of tests. They went to work, spreading the virus mostly among those, who could not have a home office. After being infected, they could not afford to buy medicament or to search for medical help since they have no insurance.[9]
Inequality in the distribution of vaccines
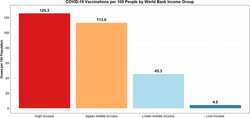
The development, production, and distribution of vaccines was a scientific, political, and economic triumph seeing that it was relatively quick. However, despite having the technology and the resources, the society failed to raise vaccine supply and distribute enough doses in poor countries.[9] "As of October 1st, 2021, the highest-income countries—as classified by the World Bank—had a per-capita vaccination rate of 125.3 vaccinations per 100 people, representing nearly 3-fold higher than the rate for lower-middle-income countries of 45.3 per 100, and 30-fold higher than lower-income countries with 4.2 per 100."[17] Also, the efficacy varied between distributed vaccines. They are more likely to be a lower efficacy on average in lower-income locations. Sputnik, Sinopharm, and Janssen vaccines are mostly used in low and middle-income countries with lower efficacy against new variants of virus compared to vaccines from Pfizer and Moderna – used mainly in higher-income areas.[17]
Inequality in education
The control measures introduced around the world to curb the spread of the virus had a considerable impact on education. By April 2020, an unprecedented 1.4 billion students were shut out of their pre-primary, primary, and secondary schools in more than 190 countries and the classroom present education had moved to online distance learning.[18] The number and duration of periods of school closures have varied across countries. Inequalities were observable in the extent to which their learning is supported by their family and home environment background. Lack of opportunities, tools, or access to affordable, reliable internet connections were daily problems to deal with.[19] Children from low-income families were more likely to be excluded from online distance learning because of an inability to afford sufficient internet or devices.[18]
Another dimension of inequality relevant to distance learning is the one between low- and high-achieving students. Education from home implies a large amount of self-regulated learning where students must independently acquire and understand the academic content without the support of teachers. This self-regulated learning may be feasible for high-achieving students, but it may be especially challenging for low-achieving students and for students with special needs.[20]
In addition, in some countries, girls have faced widespread discrimination in access to education and to the internet. Society was much more likely to expect them to take on a greater burden in the household during distance learning than boys. In developing and poor countries girls who were out of school were at greater risk than boys of facing abuses such as child marriage and other forms of gender-based violence.[18]
International wealth distribution
- Between 1820 and 2000, global income inequality increased with almost 50%. However, this change occurred mostly before 1950. Afterwards, the level of inequality remained mostly stable. It is important to differentiate between between-country inequality, which was the driving force for this pattern, and within country inequality, which remained largely constant.[21]
 Countries by total wealth (trillions USD), Credit Suisse
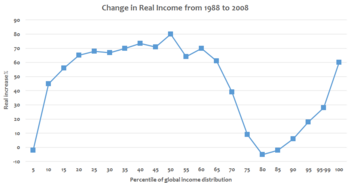
Global income inequality peaked approximately in the 1970s, when world income was distributed bimodally into "rich" and "poor" countries with little overlap. Since then, inequality has been rapidly decreasing, and this trend seems to be accelerating. Income distribution is now unimodal, with most people living in middle-income countries.[23]
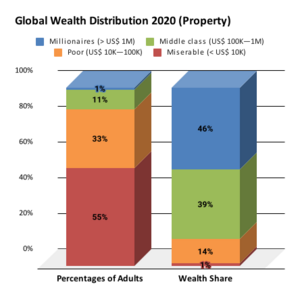
(As of 2000), a study by the World Institute for Development Economics Research at United Nations University found that the richest 1% of adults owned 40% of global assets, and that the richest 10% of adults accounted for 85% of the world total. The bottom half of the world adult population owned barely 1% of global wealth. Oxfam International reported that the richest 1 percent of people owned 48 percent of global wealth (As of 2013),[24] and would own more than half of global wealth by 2016.[25] In 2014, Oxfam reported that the 85 wealthiest individuals in the world had a combined wealth equal to that of the bottom half of the world's population, or about 3.5 billion people.[26][27][28][29][30]
(As of 2001), the major component of the world's income inequality (the global Gini coefficient) was comprised by two groups of countries (called the "twin peaks" by Quah [1997]). The first group has 13% of the world's population and receives 45% of the world's PPP income. This group includes the United States, Japan, Germany, the United Kingdom, France, Australia and Canada, and comprises 500 million people with an annual income level over 11,500 PPP$. The second group has 42% of the world's population and receives only 9% of the world PPP income. This group includes India, Indonesia and rural China, and comprises 2.1 billion people with an income level under 1,000 PPP$.[31]
In terms of between country inequality, between 1820 and 2000, Latin America, Africa and the middle east almost always had a higher average Gini coefficient than Europe, implying a higher level of inequality. Asia was usually below average.[21]
(As of 2017), over 70% of the world's adults had under $10,000 in wealth. Only 0.7% of the world had one million dollars or more in wealth, but this number is increasing.[32] (As of 2008), there were 1,125 billionaires (in US dollars) who owned $4.4 trillion in assets.[33] (As of 2006), the total value of global assets was about $125 trillion.[34]
The evolution of the income gap between poor and rich countries is related to convergence. Convergence can be defined as "the tendency for poorer countries to grow faster than richer ones and, hence, for their levels of income to converge".[35]
Global poverty

In the past, the vast majority of the world population lived in conditions of extreme poverty.[36][37]
The absolute number of poor people (living below the poverty threshold, e.g. earning below 1 dollar per day) was reasonably stable between 1820 and 1929. It then increased significantly between 1929 and 1950, and fell rapidly again after 1950 before reaching its lowest point at ca. 220 million. From 1980, there was another increase in poverty, a trend that only reversed after 1995.[21]
The percentage of the global population living in absolute poverty fell from over 80% in 1800 to under 20% by 2015.[38] According to UN estimates, (As of 2015) roughly 734 million people or 10% remained under those conditions.[39] The number had previously been measured as 1.9 billion in 1990, and 1.2 billion in 2008. Despite the significant number of individuals still below the international poverty line, these figures represent significant progress for the international community, as they reflect a decrease of more than one billion people over 15 years.[39]
In 1981, 60% of the world population (2.73 billion people) had an income of less than $2.50 per day and 42% of the world population (1.91 billion people) had an income of less than $1.25 per day. (As of 2005), these numbers had reduced to 43% and 21.5% respectively.[40] In 2002, the proportion of poor people (earning less than $3,470 per year) was 78%, while the proportion of rich people (earning more than $8,000/year) was 11%.[41]
A very severe case of income inequality can be observed on the African continent. 40-45% of the world's poor (persons earning less than 1 dollar per day) live in Africa, while only 11% of the global population inhabit the continent.[21]
Challenges in reducing global poverty include ongoing armed conflicts, low levels of support from other countries, and not knowing how to begin helping.[42]
Social welfare spending
Overall, social spending is lower in the Global South, with some regions registering just a few percentage points of GDP.[43]
Proposed solutions
Potential approaches to decrease inequality include:
- Education and family planning: Many countries with education access have higher income levels. Part of this is because people are striving for a career and are striving for higher education. Countries that do not have access to education have lower incomes. Women who have access to an education will have fewer children because they are focusing on building themselves.
- Democracy: Democracy allows people to have a say in where money is spent, such as in social welfare programs.
- Government policies: The government can create policies that can aid the poor and help provide medicine.
- Empowerment of women
- Improve agriculture: Poor countries tend to suffer from food shortages. One thing that could be done is to help improve farming grounds and livestock development. By starting the proper groundwork for crops, it will help provide the nutrition that many people need. Livestock can provide milk, eggs, meat, and cheese for consuming. This can also help provide fur and feathers for making clothing and other goods, which could be sold to help with low income.
- Volunteers who travel to poor countries to help[44]
- A global wealth tax: Thomas Piketty suggests a global and coordinated wealth tax as the remedy to trends of global inequality, saying that only a direct solution to wealth concentration can be successful where other governmental policies have failed. Piketty proposed an international agreement between nations that would tax all personal assets at phased rates. The simplest version of the proposal would levy a 1% tax on net worth between $1.3 million and $6.5 million, and a 2% tax on wealth above $6.5 million.[45] This idea has so far failed to gain ground and has been subject to criticism. Schuyler argues that a wealth tax would cause significant declines in investment, salaries, incomes, and national production, making all groups worse off. In addition, he raises problems of large administrative and enforcement hurdles, making Piketty's wealth tax impractical to a large extent.[citation needed]
- Reducing illicit wealth outflows: From 2003 to 2012, developing countries lost $6.6 trillion to illicit financial flows, with the amount rising at an average of 9.4 percent each year.[46] Since this could have been used for investments into human capital, infrastructure and economic growth, a strong correlation exists between illicit outflows and the levels of poverty and economic inequality.[47]
- Minimum wage: Minimum wage levels are often described as an important part of the challenge to reduce inequality.[48]
- Worker unions: Historically, labor unions have played an important role in reducing inequality, particularly in negotiating better pay for low-wage workers. Income disparity is typically lower in countries with higher union membership and collective bargaining coverage, while inequality tends to worsen in countries with decreasing union membership and coverage.[49]
Research has stressed the need to address inequality with a multi-pronged approach, including taxation reform and curbing excesses associated with financial deregulation, country-specific circumstances, and potential trade-offs with other policy objectives.[50]
See also
- Distribution of wealth
- Economic development
- Economic mobility
- Income disparity
- Income inequality metrics
- Income inequality in the United States
- International development
- List of countries by income equality
- Poverty
- United Nations Millennium Development Goals
- Wealth inequality in the United States
- Wealth inequality in Latin America
- Family planning in India
- Family Planning in the United States
- Global environmental inequality
References
- ↑ Goesling, Brian; Baker, David P. (June 2008). "Three faces of international inequality". Research in Social Stratification and Mobility 26 (2): 183–198. doi:10.1016/j.rssm.2007.11.001.
- ↑ "Goal 10 | Department of Economic and Social Affairs". https://sdgs.un.org/goals/goal10.
- ↑ "Archived copy". http://hdr.undp.org/statistics/data/indic/indic_4_1_1.html.
- ↑ Graph: Gapminder.org
- ↑ Mackellar, Landis; Wörgötter, Andreas; Wörz, Julia (January 2000). "Economic Development Problems of Landlocked Countries". Reihe Transformationsökonomie. https://irihs.ihs.ac.at/id/eprint/1230/.
- ↑ Faye, Michael L.; McArthur, John W.; Sachs, Jeffrey D.; Snow, Thomas (March 2004). "The Challenges Facing Landlocked Developing Countries". Journal of Human Development 5 (1): 31–68. doi:10.1080/14649880310001660201.
- ↑ Herrendorf, Berthold; Valentinyi, Ákos (April 2012). "Which Sectors Make Poor Countries so Unproductive?". Journal of the European Economic Association 10 (2): 323–341. doi:10.1111/j.1542-4774.2011.01062.x. https://orca.cardiff.ac.uk/51196/7/FinalSubmisionJEEA.pdf.
- ↑ "Archived copy". https://www.oakton.edu/user/4/ebottorf/pistor.pdf.
- ↑ 9.0 9.1 9.2 9.3 "COVID Has Made Global Inequality Much Worse". https://www.scientificamerican.com/article/covid-has-made-global-inequality-much-worse/.
- ↑ "COVID-19 and Global Income Inequality". https://www.worldbank.org/en/events/2021/02/10/covid-19-and-global-income-inequality.
- ↑ "COVID-19 and Rising Inequality". https://live.worldbank.org/covid-19-and-rising-inequality.
- ↑ "How Robots Became Essential Workers in the COVID-19 Response". 30 September 2020. https://spectrum.ieee.org/how-robots-became-essential-workers-in-the-covid19-response.
- ↑ 13.0 13.1 "COVID-19 and Global Inequality – IMF F&D". https://www.imf.org/external/pubs/ft/fandd/2020/09/COVID19-and-global-inequality-joseph-stiglitz.htm.
- ↑ Scheiber, Noam; Schwartz, Nelson D.; Hsu, Tiffany (27 March 2020). "'White-Collar Quarantine' over Virus Spotlights Class Divide". The New York Times. https://nyti.ms/2Jm2SVa.
- ↑ "Update: Which firms and industries have been most affected by Covid-19?". https://www.economicsobservatory.com/update-which-firms-and-industries-have-been-most-affected-by-covid-19.
- ↑ Etienne, Carissa F. (January 2022). "COVID-19 has revealed a pandemic of inequality". Nature Medicine 28 (1): 17. doi:10.1038/s41591-021-01596-z. PMID 35039656.
- ↑ 17.0 17.1 Rydland, Håvard Thorsen; Friedman, Joseph; Stringhini, Silvia; Link, Bruce G.; Eikemo, Terje Andreas (23 February 2022). "The radically unequal distribution of Covid-19 vaccinations: a predictable yet avoidable symptom of the fundamental causes of inequality". Humanities and Social Sciences Communications 9 (1): 1–6. doi:10.1057/s41599-022-01073-z.
- ↑ 18.0 18.1 18.2 Sheppard, Bede (17 May 2021). ""Years Don't Wait for Them": Increased Inequalities in Children's Right to Education Due to the Covid-19 Pandemic". Human Rights Watch. https://www.hrw.org/report/2021/05/17/years-dont-wait-them/increased-inequalities-childrens-right-education-due-covid.
- ↑ Darmody, Merike; Smyth, Emer; Russell, Helen (September 2021). "Impacts of the COVID-19 Control Measures on Widening Educational Inequalities". YOUNG 29 (4): 366–380. doi:10.1177/11033088211027412.
- ↑ Grewenig, Elisabeth; Lergetporer, Philipp; Werner, Katharina; Woessmann, Ludger; Zierow, Larissa (1 November 2021). "COVID-19 and educational inequality: How school closures affect low- and high-achieving students". European Economic Review 140: 103920. doi:10.1016/j.euroecorev.2021.103920. PMID 34602646.
- ↑ 21.0 21.1 21.2 21.3 van Zanden, Jan Luiten; Baten, Joerg; Földvari, Peter; van Leeuwen, Bas (2011). "The Changing Shape of Global Inequality 1820-2000: Exploring a new dataset". CGEH Working Paper Series.
- ↑ Branko Milanovic-Global Income Inequality by the Numbers-In History and Now-February 2013
- ↑ "Parametric estimations of the world distribution of income". 22 January 2010. http://www.voxeu.org/index.php?q=node/4508.
- ↑ Oxfam: Richest 1 percent sees share of global wealth jump
- ↑ Cohen, Patricia (19 January 2015). "Richest 1% Likely to Control Half of Global Wealth by 2016, Study Finds". New York Times. https://www.nytimes.com/2015/01/19/business/richest-1-percent-likely-to-control-half-of-global-wealth-by-2016-study-finds.html.
- ↑ Rigged rules mean economic growth increasingly "winner takes all" for rich elites all over world. Oxfam. 20 January 2014.
- ↑ Neuman, Scott (20 January 2014). Oxfam: World's Richest 1 Percent Control Half Of Global Wealth. NPR. Retrieved 25 January 2014.
- ↑ Stout, David (20 January 2014). "One Stat to Destroy Your Faith in Humanity: The World's 85 Richest People Own as Much as the 3.5 Billion Poorest". Time. http://business.time.com/2014/01/20/worlds-85-wealthiest-people-as-rich-as-3-5-billion-poorest/.
- ↑ Wearden, Graeme (20 January 2014). "Oxfam: 85 richest people as wealthy as poorest half of the world". The Guardian. https://www.theguardian.com/business/2014/jan/20/oxfam-85-richest-people-half-of-the-world.
- ↑ Kristof, Nicholas (22 July 2014). "An Idiot's Guide to Inequality". New York Times. https://www.nytimes.com/2014/07/24/opinion/nicholas-kristof-idiots-guide-to-inequality-piketty-capital.html.
- ↑ Milanovic 2001, p. 38
- ↑ "Global Inequality". https://inequality.org/facts/global-inequality/.
- ↑ http://www.spiegel.de: report from 6 March 2008
- ↑ http://www.spiegel.de: Report at 5 December 2006, www.orf.at: report at 5 December 2006
- ↑ "Forget Convergence: Divergence Past, Present, and Future - Finance & Development - June 1996". http://www.worldbank.org/fandd/english/0696/articles/090696.htm.
- ↑ "About the book". 1 December 2015. https://economicsandpoverty.com/teaching-tools/.
- ↑ Zanden, Jan Luiten van; Baten, Joerg; Foldvari, Peter; Leeuwen, Bas van (July 2011). "The Changing Shape of Global Inequality – exploring a new dataset". Working Papers. https://ideas.repec.org/p/ucg/wpaper/0001.html.
- ↑ Beauchamp, Zach (14 December 2014). "The world's victory over extreme poverty, in one chart". Vox. https://www.vox.com/2014/12/14/7384515/extreme-poverty-decline.
- ↑ 39.0 39.1 "PovcalNet". http://iresearch.worldbank.org/PovcalNet/povDuplicateWB.aspx.
- ↑ Chen, S.; Ravallion, M. (1 November 2010). "The Developing World is Poorer than We Thought, But No Less Successful in the Fight Against Poverty". The Quarterly Journal of Economics 125 (4): 1577–1625. doi:10.1162/qjec.2010.125.4.1577.
- ↑ Milanovic, Branko; Yitzhaki, Shlomo (June 2002). "Decomposing World Income Distribution: Does The World Have A Middle Class?". Review of Income and Wealth 48 (2): 155–178. doi:10.1111/1475-4991.00046. http://ibtjbs.ilmauniversity.edu.pk/journal/jbs/2.2/1.%20Decomposing%20World%20Income%20distribution-DoesThe%20World%20Have%20A%20Middle%20Class.pdf.
- ↑ Payne, Richard (2017). Global Issues: Politics, Economics, and Culture. Pearson Education Inc.. p. 124. ISBN 978-0-13-420205-1.
- ↑ Glenn, John (2009). "Welfare Spending in an Era of Globalization: The North-South Divide". International Relations 23 (1): 27–8, 30–1, 36–9, 45–6. doi:10.1177/0047117808100608.
- ↑ Payne, Richard (2017). Global Issues: Politics, Economics, Culture. Pearson Education Inc.. p. 125. ISBN 978-0-13-420205-1.
- ↑ Schuyler, Michael. "The Impact of Piketty's Wealth Tax on the Poor, the Rich, and the Middle Class". Tax Foundation 225: 17. https://files.taxfoundation.org/legacy/docs/TaxFoundation_SR225.pdf.
- ↑ "Global Economic Inequality–and What Might Be Done About It" (in en). https://online.norwich.edu/academic-programs/resources/global-economic-inequality%E2%80%93and-what-might-be-done-about-it.
- ↑ "Illicit Financial Flows from Developing Countries: 2003-2012 « Global Financial Integrity". 2017-08-09. http://www.gfintegrity.org/report/2014-global-report-illicit-financial-flows-from-developing-countries-2003-2012.
- ↑ "Income Inequality: Time to Deliver an Adequate Living Wage" (in en-US). https://socialprotection-humanrights.org/resource/income-inequality-time-to-deliver-an-adequate-living-wage/.
- ↑ Herzer, Dierk (2014). "Unions and income inequality: A heterogeneous panel cointegration and causality analysis". https://hdl.handle.net/10419/102306.
- ↑ Jaumotte, Florence; Buitron, Carolina Osorio (2015). Inequality and labor market institutions. International Monetary Fund, Research Department. ISBN 978-1-5135-2690-4. OCLC 914159875.[page needed]
Sources
- Milanovic, Branko (World Bank), True world income distribution, 1988 and 1993: first calculation based on household surveys alone, The Economic Journal, Volume 112 Issue 476 Page 51 – January 2002. Article: [1]. Actual report on which the article is based: [2]. News coverage: [3] and [4].
- Cole, Matthew A.; Neumayer, Eric (April 2003). "The pitfalls of convergence analysis: is the income gap really widening?". Applied Economics Letters 10 (6): 355–357. doi:10.1080/1350485032000072361. http://eprints.lse.ac.uk/603/1/AppliedEconomicsLetters_10%286%29.pdf.
- Quah, Danny T. (1 March 1997). "Empirics for Growth and Distribution: Stratification, Polarization, and Convergence Clubs". Journal of Economic Growth 2 (1): 27–59. doi:10.1023/A:1009781613339.
- Martin Ravallion, "A poverty-inequality trade-off?", World Bank, 5 May 2005, Policy Research Working Paper no. WPS 3579,
- Martin Ravallion, "Looking beyond Averages in the Trade and Poverty Debate", World Bank, November 2004, Policy Research Working Paper No. 3461
- Barro, Robert (2000). "Inequality and Growth in a Panel of Countries". Journal of Economic Growth 7 (1). http://post.economics.harvard.edu/faculty/barro/papers/p_inequalitygrw.pdf..
- "The World Distribution of Household Wealth". World Institute for Development Economics Research of the United Nations University (UNU-WIDER). 2006. http://www.wider.unu.edu/research/2006-2007/2006-2007-1/wider-wdhw-launch-5-12-2006/wider-wdhw-press-release-5-12-2006.htm. News coverage: [5] [6]
External links
- World Distribution of Household Wealth report at United Nations University
- The UC Atlas of Global Inequality explores some aspects of inequality using online, downloadable maps and graphics.
- Poverty Facts and Stats is a well-documented source of comparisons.
- UN World Social Situation Report 2005 – Inequality Predicament
- Common Dreams – Globalization Driving Inequality, UN Warns
- Heritage Foundation – Economic Freedom and Per Capita Income
 |
