Biology:Saprobic system
The saprobic system is a tool to measure water quality, and specifically it deals with the capacity of a water body to self-regulate and degrade organic matter. The saprobic system derives from so-called saprobes — organisms that thrive through degradation of organic matter, which is called saprotrophic nutrition.
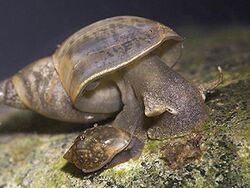
The saprobic system is based on a survey of indicator organisms. For example, the abundance of Lymnaea stagnalis water snails and other organisms is estimated, and using a formula, the listed saprobic and tolerance values of the organisms allow the water quality grade — the saprobic index — to be computed.
Saprobic water quality is expressed in four classes ranging from I to IV; and with three intermediate grades (I-II, II-III and III-IV). Water bodies of class I are the cleanest and of the highest quality. The inherent drawback of the saprobic systems as a water quality measure is that it only regards biodegradable organic material, and so ignores other factors like heavy metal pollution. Though the presence of certain organisms can rule out the presence of toxic substances, the incorporation of such organisms would deviate from the saprobic system's concept.
Computing the saprobic index
This section explains how the saprobic index of a water body is computed according to the Zelinka & Marvan method; without adjusting for several confounding factors.[1]
In a first iteration, the abundance A of each indicator species is counted and converted to categories ranging from 1 to 7. An abundance of 1 means that only one or two animals was found, while the class 7 means more than 1000 individuals during a survey. There are different abundance classes — for example, some methods use classes where the next-bigger class contains roughly double the number of individuals. The following table follows the DIN 38410-1 (2008) standard used in Germany, where the next-bigger class is about three times larger than the previous one.
| Number of individuals of each species |
Abundance class |
|---|---|
| 1 or 2 | 1 |
| >3 | 2 |
| >10 | 3 |
| >30 | 4 |
| >100 | 5 |
| >300 | 6 |
| >1000 | 7 |
The saprobic value s denotes how much organic matter must be present for an aquatic species to thrive. An animal with a saprobic value 1 can only survive in water with little organic matter present, while one with a value of 4 requires water bodies with a large amount of organic matter. The aforementioned example, the Lymnaea stagnalis snail, has a saprobic value of 2.0. The annelid worm Tubifex tubifex needs a lot of organic matter and has an s value of 3.6.
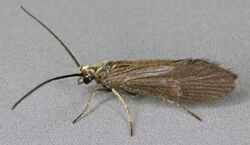
The weighting factor g has a value of either 1, 2, 4, 8 or 16, and denotes a tolerance range. If a species can survive in both unpolluted and heavily polluted water, g is very small because finding the species in a survey has little predictive value. In practice, only indicator species with a weighting factor g ≥ 4 are used. For example, a caddisfly, Agapetus fuscipes, has a g value of 16, while the zebra mussel's value is g = 4.
The saprobic index of a water body - the water quality - is finally computed with the following formula:
The water body's quality, in Roman numerals, is the rounded value of S.
Some species and their s and g values
Source[2]
| Species | Remarks | Saprobic value s |
Tolerance value g |
|---|---|---|---|
| Lymnaea stagnalis | common freshwater snail | 2.0[3] | |
| Physa fontinalis | small freshwater snail | 2.4[3] | |
| Polycelis felina | turbellaria flatworm | 1.1 | 16 |
| Gammarus pulex | crustacean | 2.0 | 4 |
| Cordulegaster boltonii | golden-ringed dragonfly | 1.5 | 8 |
| Chironomidae | larvae of a family of lake flies | 3.5[3] | |
| Deronectes platynotus | water beetle | 1.0 | 16 |
| Tubificidae | family of annelid worms | 3.6 | 4 |
The species used in Germany to measure saprobic water quality tend to group around s = 2, while other countries like Austria and the Czech Republic use a more diverse list of organisms.[4]
Pantle & Buck method
The earlier Pantle & Buck method (1955) uses the same saprobic values s of each species, but not the weighting factor g. The Pantle-Buck saprobity index S, ranging from 0 to 4, is thus calculated:
where the abundance A is expressed as one of nine subjective categories, ranging from "very rare" to "mass development". It does not require the organisms to be counted – which can save a lot of time – but raises the issues of intra- and inter-rater reliability.[1]
Confounding factors and corrections
The saprobic index is only regarded as a valid estimate if the sum of the abundance classes is at least 20. For example, if a survey only found a total of 500 individuals of any species, the sample would still be valid if the survey found four species with 125 individuals each (abundance class 5).
Likewise, a single water body has to be surveyed several times in different months in order to account for fluctuations.
During its history, several correcting factors have been introduced. For example, they deal with the flow rate of the river (fast-flowing water bodies are inherently better oxygenated, thus speeding up organic matter degradation), water acidification, and human-made changes to the water body. Likewise, corrections must be applied for the altitude of the ecosystem (lowland rivers naturally carry more organic matter than mountainous ones, where biomass production is lower), and for the different size of catchment areas.[4]
The saprobic system was never designed to accurately indicate water quality if only a selection of organisms is surveyed. Deviations can be sizeable if a survey only studies ciliates and members of the macrozoobenthos (benthos animals larger than 1 millimeter), as the latter's abundance can be easily influenced by oxygen levels and not by the availability of organic matter.[5]
History
The saprobic system has a long history in German-language countries. The idea of saprobes to estimate water quality has been foreshadowed by the works of Arthur Hill Hassall (1850) and Ferdinand Julius Cohn (1853). In a series of publications, the Germans botanists Richard Kolkwitz and Maximilian Marsson (1902, 1908, 1909) have developed the saprobic system to judge water quality.[4] They compiled a list of about 300 plant and 500 animal species (excluding fish), and estimated saprobic values for them.[citation needed]
In 1955, H. Knöpp introduced abundance classes, and the calculation of a water quality index was established during the 1950s and 1960s (Pantle & Buck, 1955; Zelinka & Marvan, 1961; Marvan, 1969).[4]
In 2000, the Pantle & Buck technique has been criticized because it requires the surveyed organisms to be identified by genus, something that freshwater ecologists are rarely trained for. Furthermore, it focuses on aquatic organisms that are prevalent in Western Europe, something that hampers water quality assays in Eastern Europe and Asia.[6]
The procedure used in Germany to estimate the saprobic index has been standardized in DIN 38410.[7]
Literature
- Fjerdingstad, E. (1971). "Microbial Criteria of Environment Qualities". Annual Review of Microbiology 25: 563–582. doi:10.1146/annurev.mi.25.100171.003023. PMID 4949039. Reviews some of the history and the issues of the saprobic system.
- Wilhm, Jerry (1972). "Graphic and Mathematical Analyses of Biotic Communities in Polluted Streams". Annual Review of Entomology 17: 223–252. doi:10.1146/annurev.en.17.010172.001255. Contains a short introduction to the saprobity index, and compares Pantle & Buck's method to the more complicated Zelinka & Marvan method.
- Knoben, R. A. E.; Roos, C.; van Oirschot, M. C. M. (1995). Biological Assessment Methods for Watercourses. UN/ECE Task Force on Monitoring & Assessment. ISBN 9036945763. https://unece.org/DAM/env/water/publications/documents/biological_assessment_methods_watercourses.pdf.
- Rolauffs, Peter; Stubauer, Ilse; Zahradkova, Svetlana; Brabec, Karel; Moog, Otto (2004). "Integration of the Saprobic System into the European Union Water Framework Directive". Integrated Assessment of Running Waters in Europe. 285–298. doi:10.1007/978-94-007-0993-5_17. ISBN 978-94-010-3761-7.
- German
- Pantle, R; Buck, H (1955). "Die biologische Überwachung der Gewässer und die Darstellung der Ergebnisse" (in de). Gas- & Wasserfach 96 (18): 604–620.
- Zelinka, M; Marvan, P (1961). "Zur Präzisierung der biologischen Klassifikation der Reinheit fliessender Gewässer" (in de). Archiv für Hydrobiologie.
- Friedrich, Günther; Herbst, Volkhard (2004). "Eine erneute Revision des Saprobiensystems - weshalb und wozu?". Acta Hydrochimica et Hydrobiologica 32: 61–74. doi:10.1002/aheh.200300518.
References
- ↑ 1.0 1.1 Knoben et al (1995)
- ↑ "Umweltgutachten der SKHP 2018 ANHANG I - Tabellen". Planungsbüros Prof. Heitkamp & LIMNA. https://www.nlwkn.niedersachsen.de/download/152973/Umweltgutachten_ANHANG_I_Tabellen.pdf.
- ↑ 3.0 3.1 3.2 Schwab, Helmut (1995). Süßwassertiere: Ein ökologisches Bestimmungsbuch. Klett. ISBN 978-3121255306.
- ↑ 4.0 4.1 4.2 4.3 Rolauffs et al (2004)
- ↑ Blatterer, Hubert (1995). "Verbessertes Verfahren zur Berechnung des Saprobienindex mittels Ciliaten (Ciliophora, Protozoa)" (in de). Lauterbornia 20: 23–36. https://www.researchgate.net/publication/273002640.
- ↑ Chertoprud, M V (2002). "Modification of Pantle-Buck Technique for Assessing Watercourse Pollution Based on Macrobenthos Quality Characteristics". Water Resources 29 (3): 306–311. doi:10.1023/A:1015632414007.
- ↑ "Deutsche Einheitsverfahren zur Wasser-, Abwasser- und Schlammuntersuchung - Biologisch-ökologische Gewässeruntersuchung (Gruppe M) - Teil 1: Bestimmung des Saprobienindex in Fließgewässern (M 1)". Deutsches Institut für Normung (DIN). 2004. https://www.din.de/de/mitwirken/normenausschuesse/naw/wdc-beuth:din21:73600999.
 |


