Biology:Family-based QTL mapping
Quantitative trait loci mapping or QTL mapping is the process of identifying genomic regions that potentially contain genes responsible for important economic, health or environmental characters. Mapping QTLs is an important activity that plant breeders and geneticists routinely use to associate potential causal genes with phenotypes of interest. Family-based QTL mapping is a variant of QTL mapping where multiple-families are used.
Pedigree in humans and wheat
Pedigree information include information about ancestry. Keeping pedigree records is a centuries-old tradition. Pedigrees can also be verified using gene-marker data.
In plants
The method has been discussed in the context of plant breeding populations.[1] Pedigree records are kept by plants breeders and pedigree-based selection is popular in several plant species. Plant pedigrees are different from that of humans, particularly as plant are hermaphroditic – an individual can be male or female and mating can be performed in random combinations, with inbreeding loops. Also plant pedigrees may contain of "selfs", i.e. offspring resulting from self-pollination of a plant.
Pedigree denotation
           SIMPLE CROSS SYMBOL                    Example
        / first order cross                          SON 64/KLRE
         //, second order cross                       IR 64/KLRE // CIAN0
           /3/, third order cross                   TOBS /3/ SON 64/KLRE // CIAN0
          /4/, fourth order cross                  TOBS /3/ SON 64/KLRE // CIAN0 /4/ SEE
            /n/, nth order cross
                BACK CROSS SYMBOL
               *n                                    n  number of times the back cross parent used
                                                     left side simple cross symbol,
                                                     back cross parent is the female,
                                                     right side – male,
                                                     Example: SEE/3*ANE, TOBS*6/CIAN0
The idea of family-based QTL mapping comes from inheritance of marker alleles and its association with trait of interest[1] has demonstrated how to use family-based association in plant breeding families.
Limitation of conventional methods
Traditional mapping populations include single family consisting of crossing between two parents or three parents often distantly related. There are some important limitations associated with traditional mapping methods. Some of which include limited polymorphism rates, and no indication of marker effectiveness in multiple genetic backgrounds. Often, by the time a QTL mapping population is developed and mapped, breeders have introgressed the new QTL using traditional breeding and selection methods. This can reduce the usefulness of MAS (marker-assisted selection) within breeding programs at the time when MAS could be most useful (i.e., shortly after new QTL are identified).[2] Family-based QTL mapping removes this limitation by using existing plant breeding families.
Common study population mapping
Broadly, there are 3 classes of study designs: study designs in which large sets of relatives from extended or nuclear families are sampled, study designs in which pairs of relatives are sampled (e.g., sibling pairs) or study designs in which unrelated individuals are sampled.
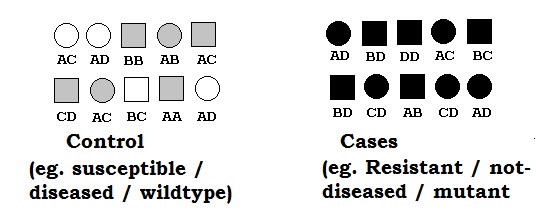
Natural collection of individuals (considered unrelated) with unknown pedigree constitutes mapping populations. The population based association mapping technique are based on this type of populations. In plant context such population are hard to find as most of individuals are someway related. Other disadvantage of such method is that even if we can find such a population, it is difficult to find high allele frequency for allele of interest (usually mutant)in such situation. For purpose of create balance in allele frequency, usually case-control studies.
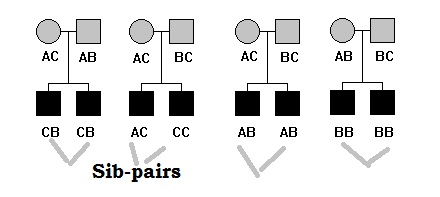
Sibpairs
Such design include a pair of sibs from multiple independent families. The members in each sibpairs are not randomly chosen – often both siblings are chosen from one tail (upper or lower) of the distribution of the QT (concordant siblings) or one sibling is chosen from the upper tail and the other sibling is chosen from the lower tail (discordant siblings). Another sampling design could include a pair of siblings, one chosen from the upper or lower tail of the distribution and the other chosen randomly from among the remaining siblings.
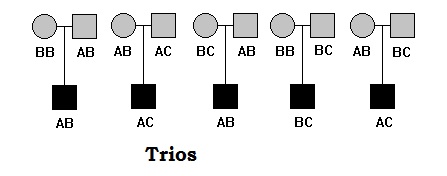
Trios
Trios include parents and one offspring (most affected). Trios are more commonly used in association studies. The concept of association mapping that each trio are unrelated, however trios are related in themselves.
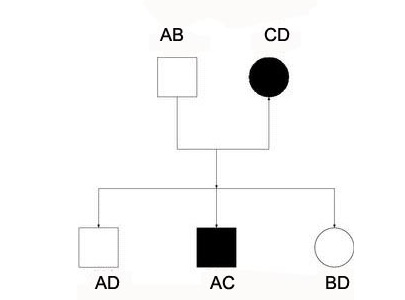
Nuclear family
Nuclear family consists of two generation simple family pedigree.
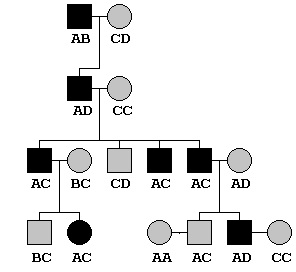
Extended pedigrees
In extended pedigree include multiple generation pedigree. It can be as deep or wide as the pedigree information is available. Extended pedigree are attractive for linkage-based analysis.
Linkage vs association analysis
Linkage and association analysis are primary tools for gene discovery, localization and functional analysis.[3][4] While conceptual underpinning of these approaches have been long known, advances in recent decades in molecular genetics, development in efficient algorithms, and computing power have enabled the large scale application of these methods. While linkage studies seek to identify loci cosegregate with the trait within families, association studies seek to identify particular variants that are associated with the phenotype at the population level. These are complementary methods that, together, provide means to probe the genome and describe etiology of complex traits. In linkage studies, we seek to identify the loci that cosegregate with a specific genomic region, tagged by polymorphic markers, within families. In contrast, in association studies, we seek a correlation between a specific genetic variation and trait variation in sample of individuals, implicating a causal role of the variant.
Family-based linkage analysis
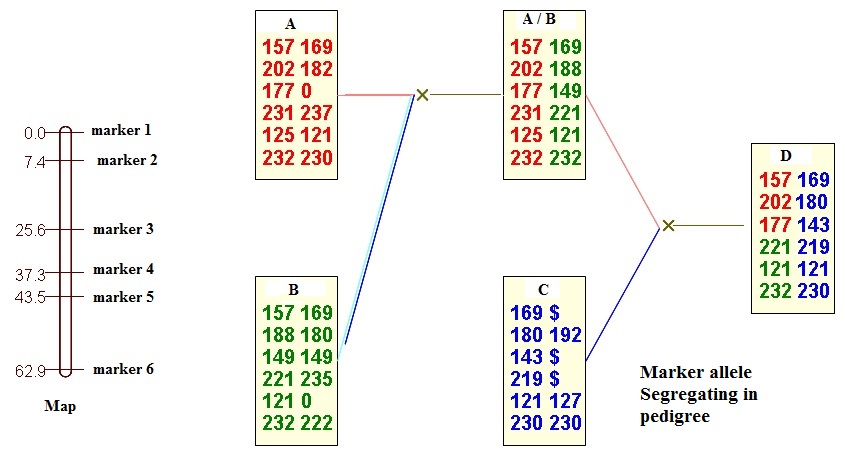
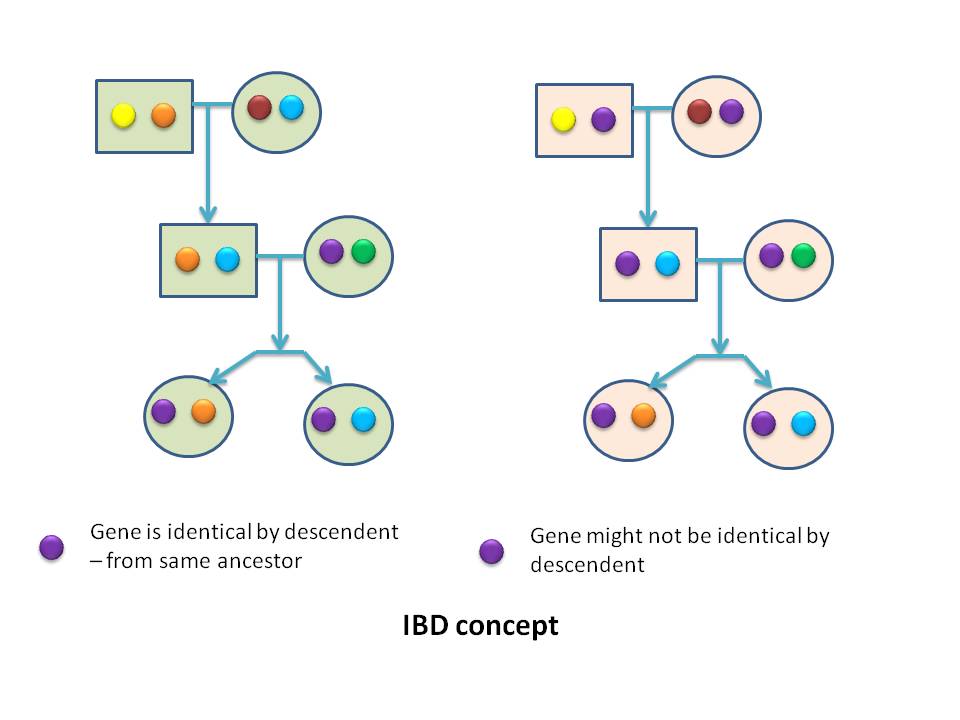
Genetic linkage is the phenomenon where by alleles at different loci cosegregate in families. The strength of cosegregation is measured by the recombination fraction θ, the probability of an odd number of recombination. More complex pedigree provide higher power. Identity by descent (IBD) matrix estimation is a central component in mapping of Quantitative Trait Loci (QTL) using variance component models. Alleles have identity by type (IBT) when they have the same phenotypic effect. Alleles that are identical by type fall into two groups; those that are identical by descent (IBD) because they arose from the same allele in an earlier generation; and those that are non-identical by descent (NIBD) or identical by state (IBS) because they arose from separate mutations. Parent-offspring pairs share 50% of their genes IBD, and monozygotic twins share 100% IBD. What is relevant in linkage analysis is the inheritance (or coinheritance) of alleles at adjacent loci; therefore; it is critical importance to determine whether the alleles are identical by descent (i.e. copies from same parental alleles) or only identical by state (i.e. appearing same, but derived from two different copies of alleles). Therefore, there three categories of family-based linkage analysis – strongly modeled (the traditional lod score model), weakly model based (variance components methods), or model free. Variance component methods may be viewed as hybrids.
Family-based association analysis
Linkage disequilibrium (LD) and association mapping is receiving considerable attention in the plant genetics community for its potential to use existing genetic resources collections to fine map quantitative trait loci (QTL), validate candidate genes, and identify alleles of interest (Yu and Buckler, 2006). The three elements of particular importance for conducting association mapping or interpreting the results include:
- the analysis of population structure into subgroups,
- its use to control for spurious associations and consequences in the specific case of differential selection among subgroups, and
- the analysis of the local structure of LD into haplotypes and its consequences on the resolution and the application of LD mapping (Flint-Garcia et al. 2003).
In contrast to population-based association, family-based association tests are becoming more popular.
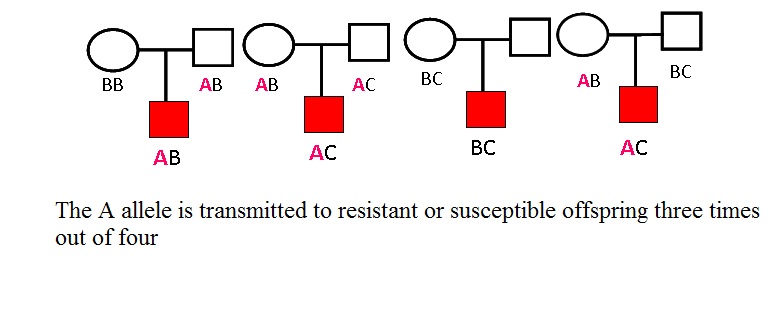
The family-based, Tran-disequilibirum test (TDT) has gained wide popularity in recent years,[citation needed] this method also focuses on alleles transmitted to affect offispring, but it is formulated to take account of both the linkage and the disequilibrium that underlie the association. The test requires genotype information on trio individuals, namely affected child and both biological parents; and at least one parent must be heterozygous for the test to be informative. The proposed test statistic is actually McNemar's chi-square statistic and tests the null hypothesis that the putative disease associated allele is transmitted 50% of the time from the heterogygous parents against the alternative hypothesis that the trait positive allele -associated allele will be transmitted more often. The TDT is not affected by population stratification and admixture. The concept of family-based test of association has been extended to quantitative traits.
Quantitative transmission disequilibrium test (QTDT)
The TDT has been extended in context of quantitative traits and nuclear or extended pedigree families. The generalized test allows to use any family type of families in testing. QTDT has also been extended to haplotype-based association mapping. Haplotypes refer to combinations of marker alleles which are located closely together on the same chromosome and which tend to be inherited together. With availability of high density SNP makers, haplotypes play an important role in association studies. First – haplotypes are critical to understanding the LD pattern across the genome, which is essential for association studies. Actually there is no better way to understand LD pattern than to know the haplotypes themselves. Haplotypes tell us how alleles are organized along the chromosome and reflect the pattern of inheritance over evaluations. Second, methods based on haplotypes can be more powerful than those based on single markers in association studies of mapping complex trait genes.
Drawing family pedigrees
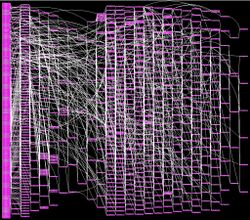
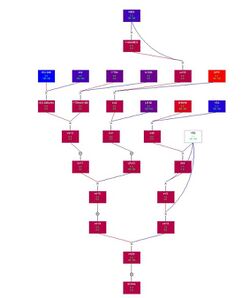
There are several pedigree drawing software available for human genetics context such as COPE (COllaborative Pedigree drawing Environment), CYRILLIC, FTM (Family Tree Maker), FTREE, KINDRED, PED (PEdigree Drawing software),PEDHUNTER, PEDIGRAPH, PEDIGREE/DRAW, PEDIGREE-VISUALIZER, PEDPLOT,PEDRAW/WPEDRAW (Pedigree Drawing/ Window Pedigree Drawing (MS-Window and X-Window version of PEDRAW)), PROGENY (Progeny Software, LLC) etc. However the pedigree drawing in plants requires some additional features such as inbreeding, selfing, mutation, polyploidy etc. which is supported in Pedimap. The pedimap can be used for pedigree visualization along with phenotypic, genotypic and ibd probabilities data in every type of plant pedigrees in both diploids and tetraploids.
See also
- Animal breeding
- Genetic association
- Marker assisted selection
- Molecular markers
- Nested association mapping
- Physiological and molecular wheat breeding
References
- ↑ 1.0 1.1 Rosyara, U. R.; Gonzalez-Hernandez, J. L.; Glover, K. D.; Gedye, K. R.; Stein, J. M. (2009). "Family-based mapping of quantitative trait loci in plant breeding populations with resistance to Fusarium head blight in wheat as an illustration". Theoretical and Applied Genetics 118 (8): 1617–1631. doi:10.1007/s00122-009-1010-9. PMID 19322557.
- ↑ Beavis W.D. (1998) "QTL analyses: power, precision, and accuracy". In: Paterson AH (ed) Molecular analysis of complex traits. CRC Press, Boca Raton, pp 145–161
- ↑ Lander, E. S.; Green, P. (1987). "Construction of multilocus genetic linkage maps in humans". Proceedings of the National Academy of Sciences of the United States of America 84 (8): 2363–2367. doi:10.1073/pnas.84.8.2363. PMID 3470801. Bibcode: 1987PNAS...84.2363L.
- ↑ Glazier AM, Nadeau JH, Aitman TJ (2002) "Finding genes that underlie complex traits". Science 298:2345–2349
- Yu J, Buckler ES (2006) "Genetic association mapping and genome organization of maize". Curr Opin Biotechnol 17:155–160
- Flint-Garcia S, Thornsberry JM, Buckler ESIV (2003) "Structure of linkage disequilibrium in plants". Annu Rev Plant Biol 54:357–374
 |
