Astronomy:Space Coast Next Generation Solar Energy Center
| Space Coast Next Generation Solar Energy Center | |
|---|---|
| <mapframe zoom="5" frameless="1" align="center" longitude="-80.681388888889" latitude="28.485277777778" height="200" width="300">{"type":"Feature","geometry":{"coordinates":[-80.68138888888889,28.485277777777778],"type":"Point"},"properties":{"marker-color":"#5E74F3","title":"Space Coast Next Generation Solar Energy Center","marker-symbol":"industrial"}}</mapframe> | |
| Country | United States |
| Location | Kennedy Space Center, Florida |
| Coordinates | [ ⚑ ] : 28°29′07″N 80°40′53″W / 28.48528°N 80.68139°W |
| Project commissioning | April 8, 2010 |
| Solar farm | |
| Type | Flat-panel PV |
| Site area | 60 acres (0.2 km2) |
| Power generation | |
| Nameplate capacity | 10 MW |
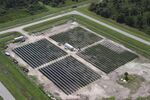
The Space Coast Next Generation Solar Energy Center is a 10 megawatt (MW) solar photovoltaic (PV) facility at the Kennedy Space Center, Florida.[1] Commissioned in April 2010, the center is the result of a partnership between NASA and Florida Power & Light. The facility has approximately 35,000 solar photovoltaic panels from SunPower covering an area of 60 acres. The facility provides slightly less than one percent of the power needed to keep Kennedy Space Center up and running.
A 1 MW solar photovoltaic array is also located at the Kennedy Space Center.[2] 
The Space Coast Next Generation Solar Energy Center was the second largest-scale solar facility in Florida, with the 25 MW DeSoto Next Generation Solar Energy Center being the largest,[1] until the construction of the 75 MW Martin Next Generation Solar Energy Center.
Production
| Year | Jan | Feb | Mar | Apr | May | Jun | Jul | Aug | Sep | Oct | Nov | Dec | Total |
|---|---|---|---|---|---|---|---|---|---|---|---|---|---|
| 2010 | 266 | 1,883 | 1,851 | 1,772 | 1,641 | 1,639 | 1,663 | 1,681 | 1,481 | 1,395 | 15,272 | ||
| 2011 | 1,285 | 1,429 | 1,829 | 1,909 | 1,852 | 1,793 | 1,708 | 1,508 | 1,540 | 1,412 | 1,362 | 1,215 | 18,842 |
| 2012 | 1,540 | 1,293 | 1,863 | 1,828 | 1,761 | 1,482 | 1,815 | 1,471 | 1,543 | 1,361 | 1,386 | 1,165 | 18,508 |
| 2013 | 1,275 | 1,447 | 1,877 | 1,640 | 1,725 | 1,518 | 1,576 | 1,705 | 1,498 | 1,631 | 1,044 | 1,233 | 18,169 |
| 2014 | 1,092 | 1,283 | 1,655 | 1,702 | 1,841 | 1,526 | 1,496 | 1,618 | 1,330 | 1,697 | 1,208 | 1,103 | 17,551 |
| 2015 | 1,303 | 1,315 | 1,687 | 1,589 | 1,903 | 1,645 | 1,609 | 1,489 | 1,356 | 1,416 | 1,272 | 1,098 | 17,682 |
| 2016 | 1,114 | 1,562 | 1,619 | 1,816 | 1,813 | 1,568 | 1,857 | 1,612 | 1,403 | 1,336 | 1,372 | 1,228 | 18,300 |
| Total | 124,324 | ||||||||||||
See also
- Copper Mountain Solar Facility
- List of photovoltaic power stations
- Renewable energy in the United States
- Renewable portfolio standard
- Solar power in the United States
References
- ↑ 1.0 1.1 FPL Launches 10-MW Space Coast PV Project (April 9, 2010) Renewable Energy World.
- ↑ Solar Power Plant at Kennedy Supplying Electricity to Floridians
- ↑ "Space Coast Next Gen Solar Energy, Monthly". Electricity Data Browser. Energy Information Administration. https://www.eia.gov/electricity/data/browser/#/plant/56930/?pin=ELEC.PLANT.GEN.56930-SUN-ALL.M&linechart=ELEC.PLANT.GEN.56930-SUN-ALL.M.
 |

