Automated ECG interpretation

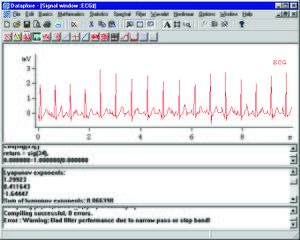
Automated ECG interpretation is the use of artificial intelligence and pattern recognition software and knowledge bases to carry out automatically the interpretation, test reporting, and computer-aided diagnosis of electrocardiogram tracings obtained usually from a patient.
History
The first automated ECG programs were developed in the 1970s, when digital ECG machines became possible by third-generation digital signal processing boards. Commercial models, such as those developed by Hewlett-Packard, incorporated these programs into clinically used devices.
During the 1980s and 1990s, extensive research was carried out by companies and by university labs in order to improve the accuracy rate, which was not very high in the first models. For this purpose, several signal databases with normal and abnormal ECGs were built by institutions such as MIT and used to test the algorithms and their accuracy.
Phases

- A digital representation of each recorded ECG channel is obtained, by means of an analog-to-digital converter and a special data acquisition software or a digital signal processing (DSP) chip.
- The resulting digital signal is processed by a series of specialized algorithms, which start by conditioning it, e.g., removal of noise, baselevel variation, etc.
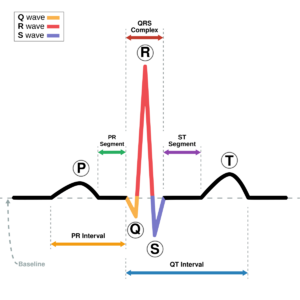
- Feature extraction: mathematical analysis is now performed on the clean signal of all channels, to identify and measure a number of features which are important for interpretation and diagnosis, this will constitute the input to AI-based programs, such as the peak amplitude, area under the curve, displacement in relation to baseline, etc., of the P, Q, R, S and T waves,[1] the time delay between these peaks and valleys, heart rate frequency (instantaneous and average), and many others. Some sort of secondary processing such as Fourier analysis and wavelet analysis[2] may also be performed in order to provide input to pattern recognition-based programs.
- Logical processing and pattern recognition, using rule-based expert systems,[3] probabilistic Bayesian analysis or fuzzy logics algorithms, cluster analysis,[4] artificial neural networks,[5] genetic algorithms and others techniques are used to derive conclusions, interpretation and diagnosis.
- A reporting program is activated and produces a proper display of original and calculated data, as well as the results of automated interpretation.
- In some applications, such as automatic defibrillators, an action of some sort may be triggered by results of the analysis, such as the occurrence of an atrial fibrillation or a cardiac arrest, the sounding of alarms in a medical monitor in intensive-care unit applications, and so on.
Applications
The manufacturing industries of ECG machines is now entirely digital, and many models incorporate embedded software for analysis and interpretation of ECG recordings with 3 or more leads. Consumer products, such as home ECG recorders for simple, 1-channel heart arrhythmia detection, also use basic ECG analysis, essentially to detect abnormalities. Some application areas are:
- Incorporation into automatic defibrillators, so that autonomous decision can be reached whether there is a cause for administering the electrical shock on basis of an atrial or ventricular arrhythmia;
- Portable ECG used in telemedicine. These machines are used to send ECG recordings via a telecommunications link, such as telephone, cellular data communication or Internet
- Conventional ECG machines to be used in primary healthcare settings where a trained cardiologist is not available
Implications and limitations
The automated ECG interpretation is a useful tool when access to a specialist is not possible. Although considerable effort has been made to improve automated ECG algorithms, the sensitivity of the automated ECG interpretation is of limited value in the case of STEMI equivalent[6][7] as for example with "hyperacute T waves",[8] de Winter ST-T complex,[9] Wellens phenomenon, Left ventricular hypertrophy, left bundle branch block or in presence of a pacemaker. Automated monitoring of ST-segment during patient transport is increasingly used and improves STEMI detection sensitivity, as ST elevation is a dynamical phenomenon.
See also
- Medical monitor
- Holter monitor
- Open ECG project
- SCP-ECG
References
- ↑ BioPac Systems. Application Note: Automated ECG Analysis
- ↑ Al-Fahoum, AS; Howitt, I. Combined wavelet transformation and radial basis neural networks for classifying life threatening cardiac arrhythmias, Med. Biol. Eng. Comput. 37 (1999), pp. 566–573.
- ↑ Mautgreve, W., et al. HES EKG expert-an expert system for comprehensive ECG analysis and teaching. Proc. Computers in Cardiology: Jerusalem, Israel 19–22 September 1989. (USA: IEEE Comput. Soc. Press, 1990. p. 77–80).
- ↑ Bortolan, G., et al. ECG classification with neural networks and cluster analysis. Proc. Computers in Cardiology. Venice, Italy, 23–26 September 1991. (USA: IEEE Comput. Soc. Press, 1991. p. 177-80).
- ↑ Sabbatini, R.M.E. Applications of artificial neural networks in biological signal processing. MD Computing, 3(2), 165-172 March 1996.
- ↑ Difficult ECGs in STEMI: lessons learned from serial sampling of pre- and in-hospital ECGs, Ayer et al., JECG, 2014
- ↑ ECG Interpretation - STEMI and equivalent, ebook
- ↑ The Prominent T wave: Electrocardiographic differential diagnosis, Sommers et al., American Journal of Emergency Medicine
- ↑ A New ECG Sign of Proximal LAD Occlusion, de Winter, NEJM, 2008
Sources
- Sabbatini, RME: O computador no processamento de sinais biológicos. Revista Informédica, 2 (12): 5–9, 1995. Computers in the processing of biological signals. (In Portuguese)
Translated and reproduced by permission of the author.
External links
- ecgAUTO in-depth ECG analysis software for preclinical research
- Kligfield, P. Automated Analysis of ECG Rhythm[yes|permanent dead link|dead link}}]
- Physionet
- Telemedical ECG Interpretation training module
 |
