Short description: Wikipedia list article

Countries by apricot production in 2016
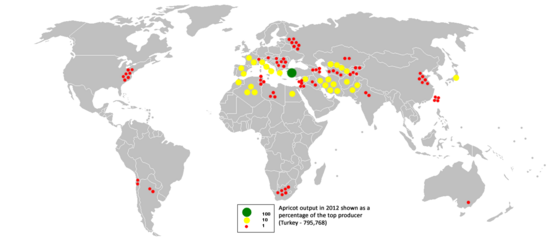
A map of world apricot production, 2012.
This is a list of countries by apricot production in 2016 and 2017, based on data from the Food and Agriculture Organization Corporate Statistical Database.[1] The estimated total world production for apricots in 2017 was 4,257,241 metric tonnes, up 9.7% from 3,766,079 tonnes in 2016.[n 1]
Production by country
>100,000 tonnes
| Rank |
Country/Region |
2017 |
2016
|
| – |
World |
4,257,241 |
3,766,079
|
| 1 |
 Turkey Turkey |
985,000 |
730,000
|
| 2 |
 Uzbekistan Uzbekistan |
532,565 |
569,820
|
| 3 |
 Italy Italy |
266,372 |
237,021
|
| 4 |
 Algeria Algeria |
256,890 |
256,771
|
| 5 |
 Iran Iran |
239,712 |
270,516
|
| 6 |
 Pakistan Pakistan |
178,957 |
177,094
|
| 7 |
 Spain Spain |
162,872 |
139,605
|
| 8 |
 France France |
148,500 |
110,850
|
| 9 |
 Afghanistan Afghanistan |
131,816 |
17,894
|
| 10 |
 Morocco Morocco |
112,538 |
71,156
|
| 11 |
 Greece Greece |
106,600 |
92,300
|
50,000–100,000 tonnes
| Rank |
Country/Region |
2017 |
2016
|
| 12 |
 Egypt Egypt |
96,226 |
89,792
|
| 13 |
 Armenia Armenia |
87,320 |
62,054
|
| 14 |
 Japan Japan |
86,800 |
92,700
|
| 15 |
 Ukraine Ukraine |
86,680 |
81,290
|
| 16 |
 Syria Syria |
63,723 |
66,431
|
| 17 |
 Russia Russia |
58,551 |
65,841
|
| 18 |
 China China |
58,035 |
56,259
|
10,000–50,000 tonnes
| Rank |
Country/Region |
2017 |
2016
|
| 19 |
 Turkmenistan Turkmenistan |
48,374 |
46,582
|
| 20 |
 Serbia Serbia |
41,320 |
25,617
|
| 21 |
 United States United States |
37,790 |
53,160
|
| 22 |
 Romania Romania |
32,640 |
30,726
|
| 23 |
 Tajikistan Tajikistan |
32,603 |
31,682
|
| 24 |
 South Africa South Africa |
30,637 |
25,916
|
| 25 |
 Tunisia Tunisia |
30,500 |
31,000
|
| 26 |
 Argentina Argentina |
27,027 |
26,901
|
| 27 |
 Azerbaijan Azerbaijan |
26,920 |
25,387
|
| 28 |
 Libya Libya |
25,433 |
24,952
|
| 29 |
 Taiwan Taiwan |
25,324 |
16,613
|
| 30 |
 Kyrgyzstan Kyrgyzstan |
25,063 |
23,973
|
| 31 |
 Lebanon Lebanon |
23,898 |
24,162
|
| 32 |
 Bulgaria Bulgaria |
22,542 |
15,503
|
| 33 |
 Hungary Hungary |
22,128 |
23,528
|
| 34 |
 Kazakhstan Kazakhstan |
17,107 |
18,630
|
| 35 |
 India India |
15,435 |
15,164
|
| 36 |
 Jordan Jordan |
15,061 |
10,959
|
| 37 |
 Iraq Iraq |
15,002 |
13,871
|
| 38 |
 Moldova Moldova |
13,743 |
21,439
|
1,000–10,000 tonnes
| Rank |
Country/Region |
2017 |
2016
|
| 39 |
 Switzerland Switzerland |
9,420 |
9,253
|
| 40 |
 Israel Israel |
8,000 |
6,500
|
| 41 |
 Chile Chile |
7,701 |
9,073
|
| 42 |
 Austria Austria |
6,484 |
5,257
|
| 43 |
 Australia Australia |
5,351 |
8,700
|
| 44 |
 Albania Albania |
5,040 |
5,194
|
| 45 |
 Portugal Portugal |
4,575 |
2,330
|
| 46 |
 Macedonia Macedonia |
3,992 |
3,471
|
| 47 |
 New Zealand New Zealand |
3,224 |
3,212
|
| 48 |
 Nepal Nepal |
1,466 |
2,767
|
| 49 |
 Madagascar Madagascar |
1,424 |
1,411
|
| 50 |
 Poland Poland |
1,335 |
3,073
|
| 51 |
 Bosnia and Herzegovina Bosnia and Herzegovina |
1,203 |
1,000
|
| 52 |
 Yemen Yemen |
1,115 |
1,714
|
| 53 |
 Palestine Palestine |
1,112 |
1,111
|
| 54 |
 Czech Republic Czech Republic |
1,019 |
782
|
<1,000 tonnes
| Rank |
Country/Region |
2017 |
2016
|
| 55 |
 Cameroon Cameroon |
949 |
915
|
| 56 |
 Canada Canada |
942 |
1,173
|
| 57 |
 Cyprus Cyprus |
889 |
819
|
| 58 |
 Mexico Mexico |
833 |
848
|
| 59 |
 Slovenia Slovenia |
760 |
961
|
| 60 |
 Croatia Croatia |
726 |
603
|
| 61 |
 Georgia Georgia |
600 |
1,500
|
| 62 |
 Ecuador Ecuador |
376 |
374
|
| 63 |
 Slovakia Slovakia |
333 |
232
|
| 64 |
 Peru Peru |
266 |
260
|
| 65 |
 Germany Germany |
214 |
219
|
| 66 |
 Kenya Kenya |
78 |
77
|
| 67 |
 Malta Malta |
44 |
21
|
| 67 |
 Zimbabwe Zimbabwe |
44 |
44
|
| 69 |
Guadeloupe |
25 |
25
|
Notes
- ↑ Sum of values for countries with available data, which may be official or FAO data based on imputation methodology
References


