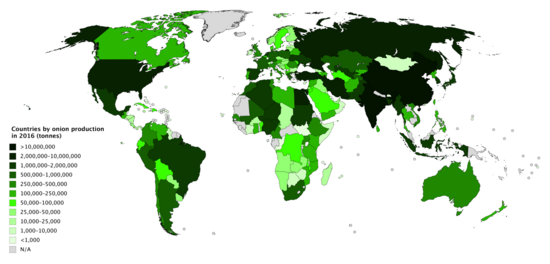
Countries by onion production in 2016
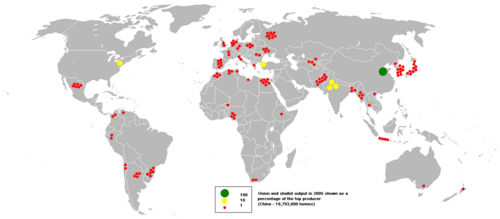
A map of onion and
shallot production, 2005.
This is a list of countries by onion production in 2016, based on data from the Food and Agriculture Organization Corporate Statistical Database .[1] metric tonnes .[n 1]
Contents
1 Production by country
1.1 >1,000,000 tonnes 1.2 500,000–1,000,000 tonnes 1.3 100,000–500,000 tonnes 1.4 50,000–100,000 tonnes 1.5 10,000–50,000 tonnes 1.6 1,000–10,000 tonnes 1.7 <1,000 tonnes
2 Notes 3 References
Production by country >1,000,000 tonnes
Rank
Country/Region
Onion production (tonnes)
1
24,783,760
2
19,415,425
3
3,115,482
4
3,025,700
5
2,345,768
6
2,255,060
7
2,023,271
8
1,792,749
9
1,739,054
10
1,735,951
11
1,735,334
12
1,710,951
13
1,691,275
14
1,657,441
15
1,583,900
16
1,526,339
17
1,497,073
18
1,446,869
19
1,281,393
20
1,251,628
21
1,184,863
22
1,123,084
23
1,046,660
500,000–1,000,000 tonnes
Rank
Country/Region
Onion production (tonnes)
24
761,332
25
712,898
26
705,633
27
677,291
28
651,349
29
641,715
30
616,505
31
600,000
32
598,690
33
556,955
34
507,495
100,000–500,000 tonnes
Rank
Country/Region
Onion production (tonnes)
35
484,321
36
469,277
37
450,645[n 2]
38
416,217
39
390,674
40
363,399
41
352,884
42
346,778
43
333,779
44
325,074
45
303,781
46
264,547
47
241,872
48
235,185
49
228,869
50
219,071
51
213,729
52
208,873
53
203,449
54
194,325
55
185,344
56
180,318
57
175,748
58
170,822
59
163,292
60
162,000
61
152,715
62
145,262
63
143,982
64
142,709
65
141,649
66
137,181
67
132,555
68
130,775
69
122,841
70
122,595
71
101,864
50,000–100,000 tonnes
Rank
Country/Region
Onion production (tonnes)
72
98,894
73
94,477
74
89,604
75
88,744
76
81,177
77
79,794
78
70,638
79
66,759
80
63,077
81
61,950
82
59,360
83
57,936[n 2]
84
57,880
85
57,133
86
56,617
87
53,922
88
53,793
10,000–50,000 tonnes
Rank
Country/Region
Onion production (tonnes)
89
49,963
90
44,996
91
43,098
92
42,175
93
42,018
94
39,086
95
37,585
96
35,277
97
35,162
98
32,020
99
31,312
100
29,492
101
29,302
102
27,602
103
26,858
104
26,521
105
26,242
106
25,752
107
23,102
108
20,751
109
19,602
110
18,500
111
18,449
112
15,922
113
15,588
114
15,154
115
14,953
116
14,522
117
12,773
118
11,306
119
11,274
1,000–10,000 tonnes
Rank
Country/Region
Onion production (tonnes)
120
9,985
121
9,160
122
8,324
123
8,306
124
8,234
125
7,699
126
7,550
127
6,000
128
5,074
129
5,066
—
4,806
—
4,403
130
4,277
131
3,569
132
2,467
133
2,133
—
2,093
134
1,616
135
1,591
<1,000 tonnes
Rank
Country/Region
Onion production (tonnes)
136
994
137
867
138
636
139
599
140
494
141
404
142
350
143
319
144
309
145
239
146
170
147
120
148
95
—
95
149
60
—
53
—
29
150
28
—
20
—
20
—
17
Notes
↑ Shallots are also included in statistics as they are a type of onion.↑ 2.0 2.1 Data not available for "Onion, shallots, green". "Onions, dry" data shown only.
References


