Chirp
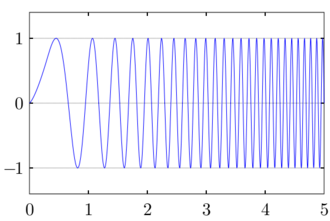
A chirp is a signal in which the frequency increases (up-chirp) or decreases (down-chirp) with time. In some sources, the term chirp is used interchangeably with sweep signal.[1] It is commonly applied to sonar, radar, and laser systems, and to other applications, such as in spread-spectrum communications (see chirp spread spectrum). This signal type is biologically inspired and occurs as a phenomenon due to dispersion (a non-linear dependence between frequency and the propagation speed of the wave components). It is usually compensated for by using a matched filter, which can be part of the propagation channel. Depending on the specific performance measure, however, there are better techniques both for radar and communication. Since it was used in radar and space, it has been adopted also for communication standards. For automotive radar applications, it is usually called linear frequency modulated waveform (LFMW).[2]
In spread-spectrum usage, surface acoustic wave (SAW) devices are often used to generate and demodulate the chirped signals. In optics, ultrashort laser pulses also exhibit chirp, which, in optical transmission systems, interacts with the dispersion properties of the materials, increasing or decreasing total pulse dispersion as the signal propagates. The name is a reference to the chirping sound made by birds; see bird vocalization.
Definitions
The basic definitions here translate as the common physics quantities location (phase), speed (angular velocity), acceleration (chirpyness). If a waveform is defined as:
then the instantaneous angular frequency, ω, is defined as the phase rate as given by the first derivative of phase, with the instantaneous ordinary frequency, f, being its normalized version:
Finally, the instantaneous angular chirpyness (symbol γ) is defined to be the second derivative of instantaneous phase or the first derivative of instantaneous angular frequency, Angular chirpyness has units of radians per square second (rad/s2); thus, it is analogous to angular acceleration.
The instantaneous ordinary chirpyness (symbol c) is a normalized version, defined as the rate of change of the instantaneous frequency:[3] Ordinary chirpyness has units of square reciprocal seconds (s−2); thus, it is analogous to rotational acceleration.
Types
Linear
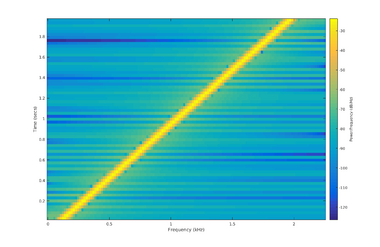
In a linear-frequency chirp or simply linear chirp, the instantaneous frequency varies exactly linearly with time: where is the starting frequency (at time ) and is the chirp rate, assumed constant:
Here, is the final frequency and is the time it takes to sweep from to .
The corresponding time-domain function for the phase of any oscillating signal is the integral of the frequency function, as one expects the phase to grow like , i.e., that the derivative of the phase is the angular frequency .
For the linear chirp, this results in:
where is the initial phase (at time ). Thus this is also called a quadratic-phase signal.[4]
The corresponding time-domain function for a sinusoidal linear chirp is the sine of the phase in radians:
Exponential
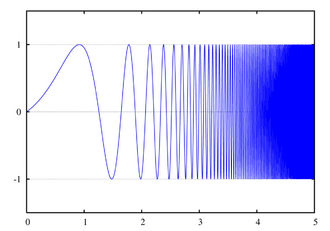
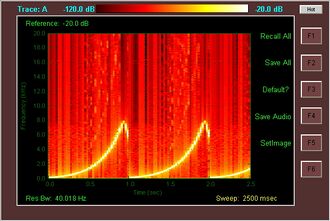
In a geometric chirp, also called an exponential chirp, the frequency of the signal varies with a geometric relationship over time. In other words, if two points in the waveform are chosen, and , and the time interval between them is kept constant, the frequency ratio will also be constant.[5][6]
In an exponential chirp, the frequency of the signal varies exponentially as a function of time: where is the starting frequency (at ), and is the rate of exponential change in frequency. Unlike the linear chirp, which has a constant chirpyness, an exponential chirp has an exponentially increasing frequency rate.
The corresponding time-domain function for the phase of an exponential chirp is the integral of the frequency: where is the initial phase (at ).
The corresponding time-domain function for a sinusoidal exponential chirp is the sine of the phase in radians:
As was the case for the Linear Chirp, the instantaneous frequency of the Exponential Chirp consists of the fundamental frequency accompanied by additional harmonics.[citation needed]
Hyperbolic
Hyperbolic chirps are used in radar applications, as they show maximum matched filter response after being distorted by the Doppler effect.[7]
In a hyperbolic chirp, the frequency of the signal varies hyperbolically as a function of time:
The corresponding time-domain function for the phase of an hyperbolic chirp is the integral of the frequency: where is the initial phase (at ).
The corresponding time-domain function for a sinusoidal hyperbolic chirp is the sine of the phase in radians:
Generation
A chirp signal can be generated with analog circuitry via a voltage-controlled oscillator (VCO), and a linearly or exponentially ramping control voltage.[8] It can also be generated digitally by a digital signal processor (DSP) and digital-to-analog converter (DAC), using a direct digital synthesizer (DDS) and by varying the step in the numerically controlled oscillator.[9] It can also be generated by a YIG oscillator.[clarification needed]
Relation to an impulse signal
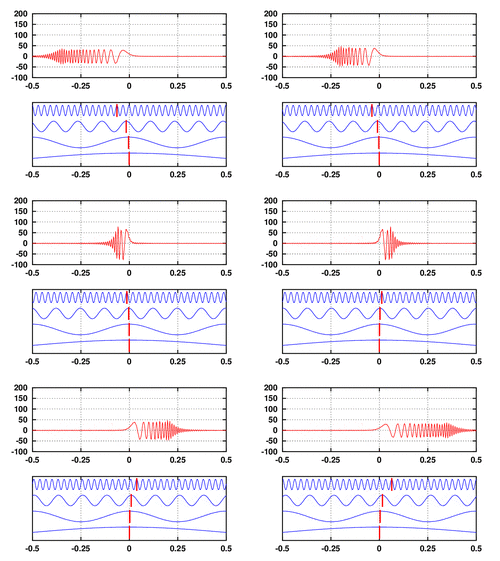
A chirp signal shares the same spectral content with an impulse signal. However, unlike in the impulse signal, spectral components of the chirp signal have different phases,[10][11][12][13] i.e., their power spectra are alike but the phase spectra are distinct. Dispersion of a signal propagation medium may result in unintentional conversion of impulse signals into chirps. On the other hand, many practical applications, such as chirped pulse amplifiers or echolocation systems,[12] use chirp signals instead of impulses because of their inherently lower peak-to-average power ratio (PAPR).[13]
Uses and occurrences
Chirp modulation
Chirp modulation, or linear frequency modulation for digital communication, was patented by Sidney Darlington in 1954 with significant later work performed by Winkler in 1962. This type of modulation employs sinusoidal waveforms whose instantaneous frequency increases or decreases linearly over time. These waveforms are commonly referred to as linear chirps or simply chirps.
Hence the rate at which their frequency changes is called the chirp rate. In binary chirp modulation, binary data is transmitted by mapping the bits into chirps of opposite chirp rates. For instance, over one bit period "1" is assigned a chirp with positive rate a and "0" a chirp with negative rate −a. Chirps have been heavily used in radar applications and as a result advanced sources for transmission and matched filters for reception of linear chirps are available.
Chirplet transform
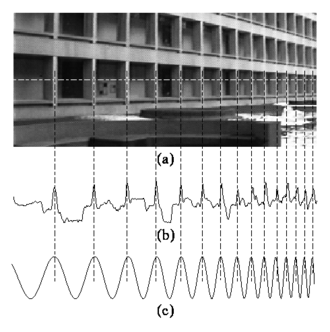
Another kind of chirp is the projective chirp, of the form: having the three parameters a (scale), b (translation), and c (chirpiness). The projective chirp is ideally suited to image processing, and forms the basis for the projective chirplet transform.[3]
Key chirp
A change in frequency of Morse code from the desired frequency, due to poor stability in the RF oscillator, is known as chirp,[14] and in the R-S-T system is given an appended letter 'C'.
See also
- Chirp spectrum - Analysis of the frequency spectrum of chirp signals
- Chirp compression - Further information on compression techniques
- Chirp spread spectrum - A part of the wireless telecommunications standard IEEE 802.15.4a CSS
- Chirped mirror
- Chirped pulse amplification
- Chirplet transform - A signal representation based on a family of localized chirp functions.
- Continuous-wave radar
- Dispersion (optics)
- Pulse compression
- Radio propagation § Measuring HF propagation
References
- ↑ Weisstein, Eric W. "Sweep Signal". From MathWorld--A Wolfram Web Resource. http://mathworld.wolfram.com/SweepSignal.html
- ↑ Lee, Tae-Yun; Jeon, Se-Yeon; Han, Junghwan; Skvortsov, Vladimir; Nikitin, Konstantin; Ka, Min-Ho (2016). "A Simplified Technique for Distance and Velocity Measurements of Multiple Moving Objects Using a Linear Frequency Modulated Signal". IEEE Sensors Journal 16 (15): 5912–5920. doi:10.1109/JSEN.2016.2563458. Bibcode: 2016ISenJ..16.5912L. https://www.researchgate.net/publication/301941486.
- ↑ 3.0 3.1 Mann, Steve and Haykin, Simon; The Chirplet Transform: A generalization of Gabor's Logon Transform; Vision Interface '91.[1]
- ↑ Easton, R.L. (2010). Fourier Methods in Imaging. Wiley. p. 703. ISBN 9781119991861. https://books.google.com/books?id=QuIHjnXQqM8C. Retrieved 2014-12-03.
- ↑ Li, X. (2022-11-15), Time and Frequency Analysis Methods on GW Signals, https://github.com/xli2522/GW-SignalGen, retrieved 2023-02-10
- ↑ Mamou, J.; Ketterling, J. A.; Silverman, R. H. (2008). "Linear chirp". NCBI 55 (2): 508–513. doi:10.1109/TUFFC.2008.670. PMID 18334358.
- ↑ Yang, J.; Sarkar, T. K. (2006). "Doppler-invariant property of hyperbolic frequency modulated waveforms". Microwave and Optical Technology Letters 48 (6): 1174–1179. doi:10.1002/mop.21573. https://www.researchgate.net/publication/229463858.
- ↑ "Chirp Signal - an overview | ScienceDirect Topics". https://www.sciencedirect.com/topics/engineering/chirp-signal.
- ↑ Yang, Heein; Ryu, Sang-Burm; Lee, Hyun-Chul; Lee, Sang-Gyu; Yong, Sang-Soon; Kim, Jae-Hyun (2014). "Implementation of DDS chirp signal generator on FPGA". 2014 International Conference on Information and Communication Technology Convergence (ICTC). pp. 956–959. doi:10.1109/ICTC.2014.6983343. ISBN 978-1-4799-6786-5. https://www.researchgate.net/publication/290854522.
- ↑ "Chirped pulses". setiathome.berkeley.edu. http://setiathome.berkeley.edu/ap_chirp.php.
- ↑ Easton, R.L. (2010). Fourier Methods in Imaging. Wiley. p. 700. ISBN 9781119991861. https://books.google.com/books?id=QuIHjnXQqM8C. Retrieved 2014-12-03.
- ↑ 12.0 12.1 "Chirp Signals". dspguide.com. http://www.dspguide.com/ch11/6.htm.
- ↑ 13.0 13.1 Nikitin, Alexei V.; Davidchack, Ruslan L. (2019). "Bandwidth is Not Enough: "Hidden" Outlier Noise and Its Mitigation". arXiv:1907.04186 [eess.SP].
- ↑ The Beginner's Handbook of Amateur Radio By Clay Laster
External links
- Online Chirp Tone Generator (WAV file output)
- CHIRP Sonar on FishFinder
- CHIRP Sonar on FishFinder
 |

