DMelt:General/Android
DataMelt for Android
DataMelt Java libraries were ported on the Android platform. Such application is called AWork (https://datamelt.org/?id=awork). AWork is a complete programming environment that can execute standard Java syntax and extends it with scripting conveniences such as loose types and commands. At the same time, it allows to use scientific Java libraries to perform complex mathematical and statistical calculations with scientific graphs on tables and smartphones.
The AWork application can be downloaded from the AWork on GooglePlay.
Currently, most of the DataMelt API related to data analysis is supported. But the main scripting language is [[DMelt:Programming/2_BeanShell] BeanShell]. You can use the Octave/Matlab syntax (See JMathLabTutorial:Start and DMelt:Symbolic/2_Jasymca).
After the installation on an Android tablet or smartphone, click on the AWork icon. This application is shown here:
Use the editor to write a code in either Octave/Matlab-like language, or using BeanShell scripting. The latter approach allows to use Java numeric libraries from the DataMelt project together the full access to  jhplot/ core package.
After installing AWork
You can run a number of examples located in the directory "AWorkEditor/examples".
Run examples that create graphs using BeanShell or Matlab/Octave. Start the application, click "open file" (left menu) and find in the directory "AWorkEditor" which is usually located on your storage. Then click this directory and look at the examples folder. You will see example files:
chart_pie.bsh   # show Pie Chart
data.bsh           # show scattered points
data_func.bsh  # show data and functions
function.bsh     # show functions
histo.bsh          # show two overplayed histograms
statistics.sh      # full statistical analysis of two random distributions
integrate.m      # symbolic integration using Octave/Matlab
plot.m              # plotting using Octave/Matlab
.....
Open one of these files in the AWork editor. Then use right menu and click the button "Run". Then, open again top-right menu and select the button "Graph". If the output of your script is text, click the button "Output". Note that the examples are based on the canvas  jhplot.HChart.
Look at this YouTube video which shows how to get started with AWork.
Included Java packages
Compared to DataMelt, AWork includes a reduced set of scientific Java libraries. AWork Javadoc shows which Java libraries are included to AWork.
Using BeanShell syntax
BeanShell is a simple scripting language for the Java platform. You can learn about BeanShell in DMelt:Programming/2_BeanShell.
You can write your program using BenShell scripting language and run it using the “run” button. If your code contains the “import” statement (usually always does for BeanShell scripts), the program will be recognized as a BeanShell code and it will execute it. Look at the output using the “Output” button. If these will be no "import" statement, the program will interpret your code.
BeanShell is a simple scripting language for the Java platform. You can learn about BeanShell in DMelt:Programming/2_BeanShell
Text outputs can be viewed by using the button **Output**. If you use the BeanShell command "print(object)" or "println(object)", the output will be printed in the text filed which can be opened with the "Output" button. Note that the print message simply calls object.toString() method.
The same **Output** button is used to see error messages. If you see that your program does not run, click on the "Output" to see what is wrong.
You can view the graphs by pressing the **Graph** button. You can zoom in into the graphs etc. Make a screenshot to generate an image file.
Getting started. Calculations
Use the standard BeanShell statements to evaluate Java expression. To print the outputs, use the print statement. Here is an example:
import java.lang.*;
print(30*30);
Press "Run" and then "Output". You will see the answer 900. Note the semicolon after each line.
In principle, the "import" statement is not needed in this example. It has the purpose to tell to AWork
that this is a BeanShell code and it must be executed as a BeanShell code when you press the "run" button. |
The "print(object)" method works for any object which has "toString()" method. One can access any Java class from java.lang.*, including the "Math" library. BeanShell imports java.lang and java.utils. automatically, thus you do not need to import such packages. Here is an example:
import jhplot.*;
print(Math.sqrt(2));
which will print the answer in the output window. Here we import external graphic/numeric library which will be needed for next examples.
It is more convenient to import all Math functions as:
import java.lang.Math.*;
print(sqrt(2));
One can also use the complete jhplot package with the numerical libraries. For example, let us create a 1D array and fill with with random numbers:
import jhplot.*;
p= new P0D("test");
a=p.randomNormal(100,0,1); // 100 Normally-distributed numbers with mu= and sigma=1
print(a); // print random numbers.
One can also evaluate functions using jhplot package:
import jhplot.*;
p= new F1D("x*x",0,10);
print(p.eval(0.4)); // evaluate at x=0.4
Graphical canvases
Unlike the full version of DataMelt which supports many Java-based canvases
the graphical representation of functions, array, histograms in AWork is based on the  jhplot.HChart
Currently, no support for 3D canvases exits. Also, you cannot plot several drawing pads as it can be usually done
using the Java version of the HChart canvas (and this does not make too much sense anyway due to small sizes of screens
of Android devices).
The examples for the android platform can be run on the Java platform as well. Only replace **and.awt** library by **java.awt** (for colors, fonts etc). On the Java platform, you should also call "visible()" for HChart canvas to bring up swing frame with the image. |
Plotting functions
This is a small example to evaluate a function and show it on the canvas. Note that colors are taken from the "and.awt" package.
import jhplot.*;
import and.awt.*;
p= new F1D("x*x",0,10);
g= new F1D("x*x*cos(x)",-10,10);
print(p.eval(0.4));
c=new HChart();
p.setColor(Color.red);
p.setPenWidth(4);
c.add(p);
c.add(g);
c.update();
Save this code in a file "example.bsh", load it in the AWork editor and press "run". You will see two functions shown on top of each other. You can zoom in and zoom out such functions. Make a snapshot of the screen to get a image file.
The output on an android tablet screen is:
Showing data points
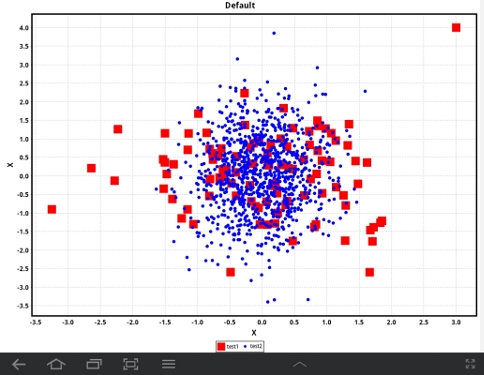
This example shows how to show a scatter XY plot of data points. We make 2 P1D containers and fill randomly points using a Gaussian distribution from java.util package. The we print one container on the screen.
import jhplot.*;
import java.util.Random;
import and.awt.*;

p= new P1D("test1");
g= new P1D("test2");
r=new Random();
for (i=0; i<100; i++) p.add(r.nextGaussian(),r.nextGaussian());
for (i=0; i<1000; i++) g.add(0.5*r.nextGaussian(),r.nextGaussian());
c=new HChart();
p.setColor(Color.red);
p.setSymbolSize(16);
p.setSymbol(5);
g.setColor(Color.blue);
c.add(p);
c.add(g);
c.update();
print(p);
You may notice that we used the "print(p)". It print the object (P1D) to the console which can be opened by pressing the button "Output".
The output will be shown as:
Showing data points and functions
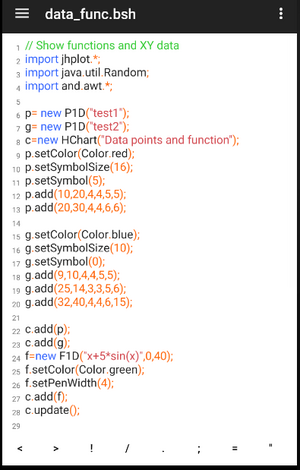
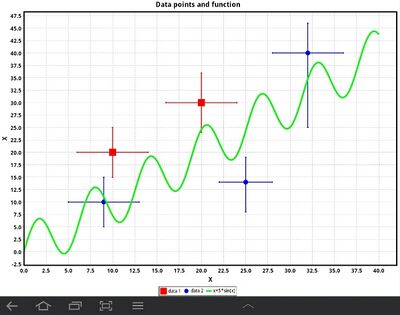
In this example we draw data points with statistical errors and a function. We use "add" method to add these points.
import jhplot.*;
import java.util.Random;
import and.awt.*;

p= new P1D("test1");
g= new P1D("test2");
c=new HChart("Data points and function");
p.setColor(Color.red);
p.setSymbolSize(16);
p.setSymbol(5);
p.add(10,20,4,4,5,5);
p.add(20,30,4,4,6,6);

g.setColor(Color.blue);
g.setSymbolSize(10);
g.setSymbol(0);
g.add(9,10,4,4,5,5);
g.add(25,14,3,3,5,6);
g.add(32,40,4,4,6,15);

c.add(p);
c.add(g);
f=new F1D("x+5*sin(x)",0,40);
f.setColor(Color.green);
f.setPenWidth(4);
c.add(f);
c.update();
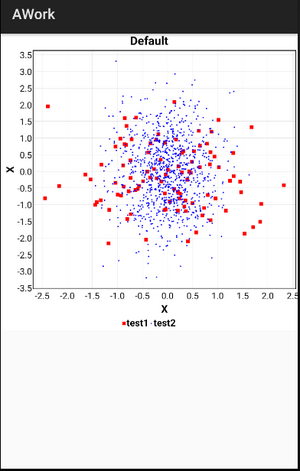
The output of this example is overlaid data points and the function:
Showing histogram
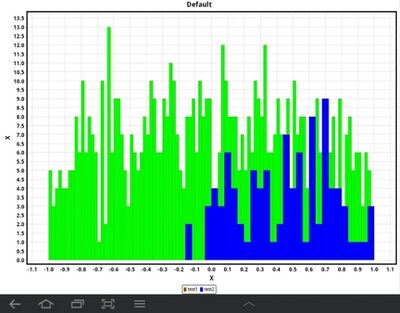
This example shows how to draw a histogram:
import jhplot.*;
import java.util.Random;
import and.awt.*;

p=new H1D("test1",100,-1,1);
g=new H1D("test2",50,-1,1);
p.setFillColor(Color.red);
p.setColor(Color.green);
g.setColor(Color.blue);
r=new Random();
for (i=0; i<1000; i++) p.fill(r.nextGaussian());
for (i=0; i<100; i++) g.fill(0.5+0.3*r.nextGaussian());
print (p.getColor().toString());
c=new HChart();
c.add(p);
c.add(g);
c.update();
print(p);
The output on the tablet screen is:
Pie charts
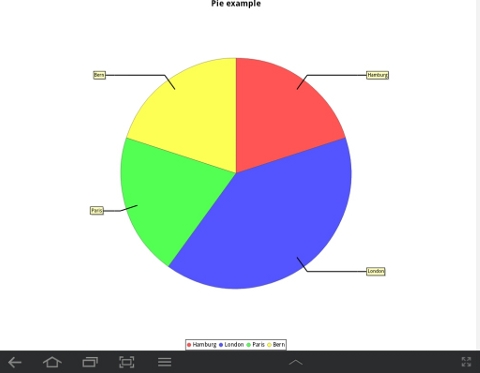
Here is an example of the Pie chart:
import jhplot.*;

c1 = new HChart("Canvas");
c1.setChartPie();
c1.setName("Pie example");
c1.valuePie("Hamburg",1.0);
c1.valuePie("London",2.0);
c1.valuePie("Paris",1.0);
c1.valuePie("Bern",1.0);
c1.update();
The output on an Android device screen is:
Line charts
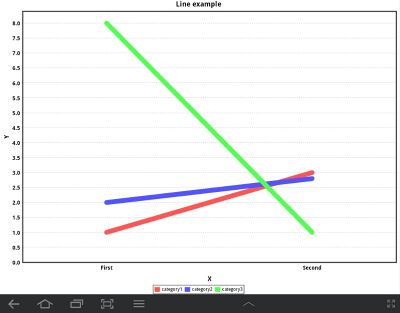
Similarly, one can draw the lines:
import jhplot.*;

c1 = new HChart("Canvas");
c1.setChartLine(12); // set line width here
c1.setName("Line example");
c1.valueLine(1.0, "First", "category1");
c1.valueLine(2.0, "First", "category2");
c1.valueLine(10.0, "First", "category3");
c1.valueLine(8.0, "First", "category3");

c1.valueLine(3.0, "Second", "category1");
c1.valueLine(2.8, "Second", "category2");
c1.valueLine(4.0, "Second", "category3");
c1.valueLine(1.0, "Second", "category3");
c1.update();
The output on an Android device is:
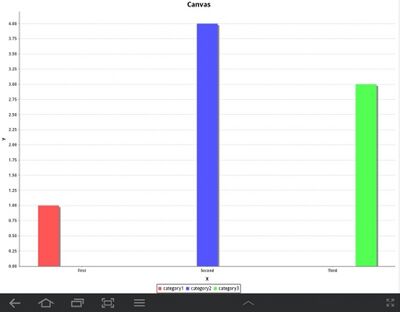
Bar charts
The bar chart style is shown here:
import jhplot.*;

c1 = new HChart("Canvas");
c1.setChartBar();
c1.valueBar(1.0, "First", "category1");
c1.valueBar(4.0, "Second", "category2");
c1.valueBar(3.0, "Third",   "category3");
c1.update();
Input and output
The Android version supports the same input output Java classes as the standard Java application, as well as
Java-implemented classes such as  jhplot.HFile (Java compressed serialization),
  jhplot.HPlotXML (XML serialization).
In this example we show how to create a several objects, write them into a compressed serialized file and then to restore them for plotting:
import jhplot.*;
import jhplot.io.*;
import java.util.Random;
import and.awt.*;

p= new P1D("test1");
g= new P1D("test2");
r=new Random();
for (i=0; i<100; i++) p.add(r.nextGaussian(),r.nextGaussian());
for (i=0; i<1000; i++) g.add(0.5*r.nextGaussian(),r.nextGaussian());
p.setColor(Color.red);
p.setSymbolSize(16);
p.setSymbol(5);
g.setColor(Color.blue);

f= new HFile("/mnt/sdcard/test.ser","w"); // write the data
f.write(p);
f.write(g);
f.close();
f= new HFile("/mnt/sdcard/test.ser"); // read the data
p=f.read();
g=f.read();
f.close();

c=new HChart(); # plot data
c.add(p);
c.add(g);
c.update();
Saving this into a file test.bsh and executing it, you will see a scatter plot with the data. You may notice that even graphical attributes of the objects are restored correctly. Be careful with the path to the file - if it will be wrong then you will not be able to write objects to such file. In this case we use a sdcard" to store the data.
As usual, you cannot serialize graphical canvases (like HChart in this example).
But you can write essentially any Java class into a file and restore it later.
One can also make collection of objects and write them at once using the "Serialized" class
as discussed in Section DMelt:IO/3_Java_Serialization
Symbolic calculations
You can use Octave-scripting language directly in AWork as explained in JMathLabTutorial:Start and DMelt:Symbolic/2_Jasymca section. Yet, you can call symbolic calculations from the BeanShell.
You can use AWork for symbolic calculations in exactly the same way as it is described in the section DMelt:Symbolic/2_Jasymca. You can integrate, differentiate, simplify, solve equations. Remember that you should use the BeanShell syntax.
import jhplot.math.*;
j=new Symbolic("jasymca");
s="syms x; trigrat(sin(x)^2+cos(x)^2)";
print(j.eval(s));
In the above program we used the Jasymca engine to evaluate the expression written in the MatLab/Octave mode.
Similarly, you can use other symbolic engines, such as "jscl". For example, let us integrate the function:
cos(x)+x^2
You BeanShell code will look as:
import jhplot.math.*;
j=new Symbolic("jscl");
s1="integral(cos(x)+x^2,x)";
print(j.eval(s));
The answer is
(x^3+3*sin(x))/3
Using Matlab syntax
You can use AWork to perform the following calculations:
- Symbolic calculations (simplification, differentials, integration)
- Numeric calculations evaluations of mathematical functions designed to be used in evaluating complex expressions
- Evaluations of mathematical functions, special functions
- Linear algebra with vectors and matrices
- Plotting data and functions, saving data (vectors and matrices) in files
- Random numbers
- Basic statistics
- Solving linear and non-linear equations and systems of equations
You can write programs in Octave (Matlab) language and run them using the "run" button. If your code does not contain "import" statement (as for BeanShell), the program will be recognized as symbolic calculations and will execute it. Look at the output using the "Output" button.
AWork uses the the computational core from the [ http://jwork.org/jmathlab/] applications. See JMathLabTutorial:Start.
jMathLab Tutorials
Symbolic calculations are based on package and use Matlab/Octave language. jMathLab is a derivative of the Jasymca program, but contains additional packages to bring it closer to Matlab and Octave programs.
You can learn about it using the [1]. Note: Java is required to run interactive examples. Type the following code example:
To output text, use **disp** method (as in Octave)
disp("Text");
And press "run". Look at the output pressing "Output".
You can also print any variable as:
x=log(200);
printf('Answer=%f',x)
You should save your code with the extension ".m", since the syntax matches to Octave/Matlab.
Let us give another example: symbolic integration. The code is shown here.
syms x;
y=(x^3+2*x^2-x+1)/((x+i)*(x-i)*(x+3))
ans=integrate(y,x)
printf('ans=%f',ans)
It prints the answer in the "Output window".
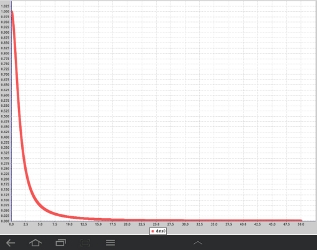
One can also plot data in the usual way using the "plot" command. It should be noted that not-all plotting feature are not available yet, but most of them are already available.
Here is a small example:
x=0.01:0.01:50; y=1./(1+0.5*x.*x);
plot(x,y);
Pres "run" and then "graph". You will see the output:
Similarly, one can plot functions:
x=-10:0.1:10;
plot(x,cos(x));
plot(x,sin(x));
This code plots cos(x) function with the step 0.1, and then overlays the function sin(x).
Read JMathLabTutorial:Start.
Credits
The AWork project is based on several open-source libraries. First of all, it is based on TurboEditor by Vlad Mihalachi. Then it includes BeanShell. Both these projects are opensource. They are made available under the terms of the GPLv3.
AWork includes the following open-source Java libraries:
- Colt Java library
- Apache Math3
- JDistLibs
- BeanShell
- Jaysymca
- 920 TextEditor (parts of it)
- AFreeChart
- FreeHEP
- JMinHEP
- EXP4J
- BLAS
- LAPACK
- XSTREAM
- JAMA
The binaries are subject to the licensing terms of these packages.
