DMelt:General/Scientific Tools
Scientific tools
Here we will discuss a few software tools for scientific analysis of data shipped with DMelt.
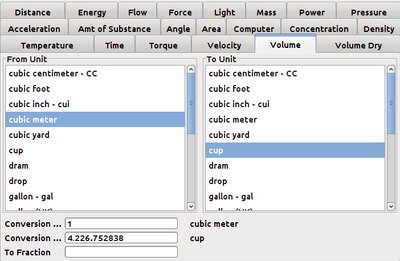
Unit conversion
DataMelt can be used to easily convert between different units of measurement. Simply start DataMelt IDE and select [Tools]->[Unit conversion].
Read more in "Measurements with Units" on how to access this tool in Java/Jython programs.
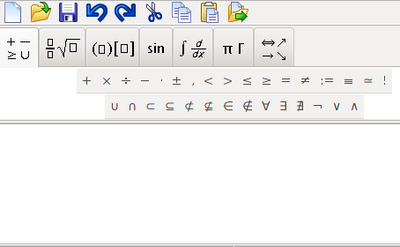
LaTeX and MathML equations
Start it as [Tools]-[DragMath]
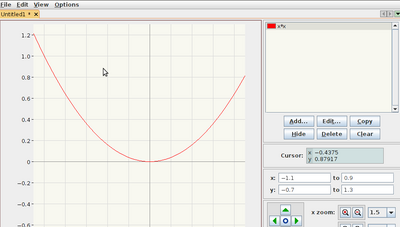
Interactive function plotter
Start it as [Tools]-[2D function plotter]
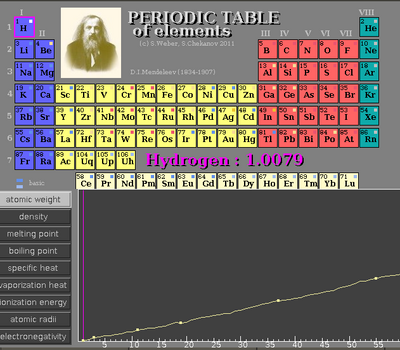
Periodic table
Start it as [Tools]-[Periodic table]
Data extraction from a figure
Use DataMelt to extract data points from image and save them into a file. Assume you have a image "example.gif" which shows some plot. You can open any image in the format PNG, JPEG or GIF. Open this image as:
from debuxter import JDebux
c1=JDebux("example.gif")
You will see a windows with the image:
Now perform a calibration of X and Y axis. Select a X-range, say between 0 and 6, and type there numbers in the field X0 and X1. The use the mouse and drag the cursor along the X axis between 0 and 6. As you drag you will see a red line spanning 0 and 6.
Then calibrate the Y-axis. Select a Y-range, type it in the window to the left of the window (Y0 and Y1). Then use the mouse to draw a blue line between selected range along Y-axis.
Once the calibration is complete, start clicking with the mouse on the data line. You will see green crosses. Then select "Save data". Data will be written into a file "example.gif.unknown" in the same directory.


