Earth:Multivariate ENSO index
The multivariate ENSO index, abbreviated as MEI, is a method used to characterize the intensity of an El Niño Southern Oscillation (ENSO) event. Given that ENSO arises from a complex interaction of a variety of climate systems, MEI is regarded as the most comprehensive index for monitoring ENSO since it combines analysis of multiple meteorological and oceanographic components.[1]
Overview
MEI is determined as the first principal component of six different parameters: sea level pressure, zonal and meridional components of the surface wind, sea surface temperature, surface air temperature and cloudiness using data from the International Comprehensive Ocean-Atmosphere Data Set (ICOADS ).[2] MEI is calculated twelve times per year for each “sliding bi-monthly season”, characterized as January–February, February–March, March–April, and so on.[2] Large positive MEI values indicate the occurrence of El Niño conditions, while large negative MEI values indicate the occurrence of La Niña conditions.[2]
Extended MEI
While the National Oceanic and Atmospheric Administration (NOAA) has recorded MEI values from 1950 to the present, various researchers have cited the need for data before 1950 in order to better characterize typical ENSO behavior versus unusual occurrences that may be a result of climate change.[3] According to some sources, it is inadvisable to attempt to calculate MEI before 1950 given that environmental measurements were unreliable during the World Wars and there was a revolution in virtually all meteorological measurement methods on ships during the 1940s.[4] However, a module known as “Extended MEI” or “MEI.ext” has been created that estimates MEI values from as far back as 1871.[3] This was accomplished by using reconstructed data on sea level pressure and sea surface temperature, the two components thought to be most influential to determining MEI. Plots comparing MEI and MEI.ext values have shown that data from both methods are highly correlated, supporting the accuracy and effectiveness of MEI.ext.[3]
Alternate indexes
Southern Oscillation Index
The Southern Oscillation Index (SOI) is calculated based on the sea level pressure difference between Tahiti and Darwin, Australia.[4] Despite being used frequently in ENSO studies, it is not considered as reliable as MEI given that it only takes into account one environmental variable.
Niño 3.4 SST

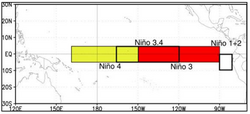
Similar to SOI, Niño 3.4 SST uses one parameter – sea surface temperature – to characterize ENSO. The Niño 3.4 SST region (overlapping regions 3 and 4, see map) consists of temperature measurements from between 5° N – 5° S and 120° – 170° W.[5]
Coupled ENSO Index
The Coupled ENSO Index (CEI) uses a combination of both the SOI and Niño 3.4 SST to account for both an atmospheric and oceanic component.[5]
Proxy-based ENSO Index
Developed by Braganza, et al., 2009, this index uses coral, tree ring and ice core data to characterize ENSO events from 1525 – 1982. The proxy ENSO index covers a wide area across the Pacific, and includes data from the western and central Pacific, New Zealand, and subtropical North America. Although the proxy ENSO index covers a large time scale of over four centuries, it shows high correlation (> 40%) with the SOI, Niño 3.4 SST and CEI, indicating its accuracy and utility.[6]
References
- ↑ Mazzarella, A., A. Giuliacci, and N. Scafetta. "Quantifying the Multivariate ENSO Index (MEI) Coupling to CO2 Concentration and to the Length of Day Variations." Theoretical and Applied Climatology 111.3 (2013): 601-7.
- ↑ 2.0 2.1 2.2 Wolter, Klaus. "Multivariate ENSO Index (MEI)." NOAA Earth System Research Laboratory - Physical Sciences Division. National Atmospheric and Oceanic Administration, n.d. Web. 24 Oct. 2013.
- ↑ 3.0 3.1 3.2 Wolter, Klaus, and Michael S. Timlin. "El Niño/Southern Oscillation Behaviour since 1871 as Diagnosed in an Extended Multivariate ENSO Index (MEI.ext)." International Journal of Climatology 31.7 (2011): 1074-87.
- ↑ 4.0 4.1 Wolter, Klaus, and Michael S. Timlin. "Measuring the Strength of ENSO Events: How Does 1997/98 Rank?" Weather 53.9 (1998): 315-24.
- ↑ 5.0 5.1 Gergis, Joëlle L., and Anthony M. Fowler. "Classification of Synchronous Oceanic and Atmospheric El Niño-Southern Oscillation (ENSO) Events for Palaeoclimate Reconstruction." International Journal of Climatology 25 (2005): 1541-65
- ↑ Braganza, Karl, Joelle L. Gergis, Scott B. Power, James S. Risbey, and Anthony M. Fowler. "A Multiproxy Index of the El Nin ̃o–Southern Oscillation, A.D. 1525– 1982." Journal of Geophysical Research 114 (2009): 1-17.
 |
