Engineering:Flow straightener
A flow straightener, sometimes called a honeycomb, is a device used to straighten the air flow in a wind tunnel. It is a passage of ducts, laid along the axis of main air stream to minimize the lateral velocity components caused by swirling motion in the air flow during entry. The cross-section shapes of these "honeycombs" may be of square, circular and regular hexagonal cells.
A low-cost handmade flow straightener
A low-cost flow straightener can be constructed using drinking straws, as they have low cost and good efficiency. The MythBusters television show used such a construction for their wind tunnel, as did an experimental wind tunnel at MIT (Maniet). The straws should be cut to equal size and placed in a frame.
Effectiveness of honeycomb
The effectiveness of honeycomb, in reducing the swirl and turbulence level, is studied by simulating the flow field using standard k-ε turbulence model in commercial computational fluid dynamics (CFD). CFD is the most precise and economical approach to estimate the effectiveness of a honeycomb.
Computational model
A computational domain of honeycomb is created as shown in Fig. 1
We know computationally, it is very difficult to provide the realistic non-uniform flow at the entry of honeycomb as experienced in the experiments. Such random inlet conditions would essentially simulate the realistic case in which air can enter the honeycomb from any direction and at any level of turbulence. Therefore, special domain is designed for introducing practical inlet condition
Meshing of Computational Models
The solid model of honeycomb is meshed in GAMBIT 2.3.16. As shown in Fig. 2. A structured rectangular mesh is used for the simulation with square honeycomb configuration. Governing equations for mass and momentum conservations for subsonic flow along with the equations for turbulence and porous flow are solved for the honeycomb using commercial CFD. RANS type RNG k-ε model is used for the turbulence modeling.
Boundary Conditions
The separate domain created upstream of the honeycomb is provided with various inlet conditions to arrive at the disorderly motion at the exit, which should be given as an inlet to the honeycomb cells. This essentially simulates the more realistic case that the flow can enter into the honeycomb from any direction. Specifications of this inlet along with other necessary boundary conditions are mentioned here. Flow at the inlet of the honeycomb shall necessarily have turbulent and swirling motions. Therefore, in order to incorporate these requirements, a separate fluid domain is constructed.
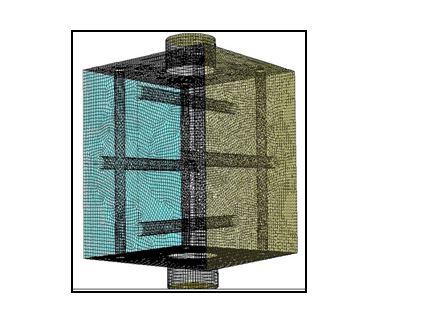
Top and bottom circular faces are considered as inlet to this domain to get a flow field with higher magnitude of lateral velocity. This domain is provided with vertical and horizontal cylinders as an obstruction to the inlet to produce sufficient swirling at the exit of this section. A tetrahedral mesh as shown in Fig. 3 with tetrahedral elements is generated for this geometry. The number of nodes are 1,47,666. Three faces of this configuration are specified as inlets with velocity boundary conditions. Fluid velocity at these inlet faces has been so taken that averaged mean velocity at the outlet is 1 m/s, which is in the operational wind tunnel.
A pressure outlet boundary condition is used at exit of the settling chamber where pressure at outlet is set to zero for gauge pressure. It is always possible to predict the entire flow field by meshing whole fluid domain; however simulation for the prediction of entire flow field using symmetry boundary condition. This approach reduces the mesh requirement and computational efforts. Therefore, symmetry boundary is used at the periphery of the computational domain.
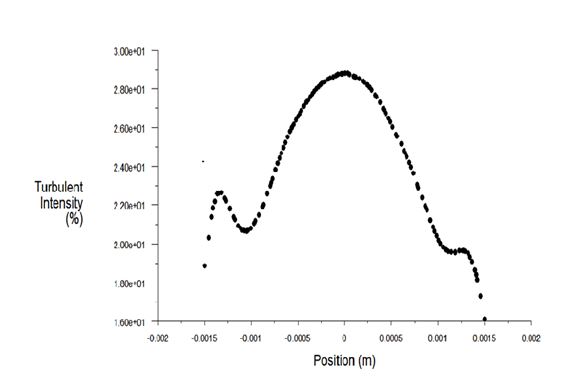
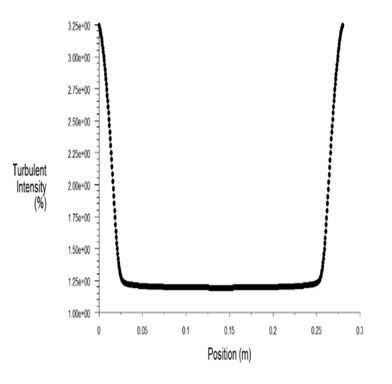
All the solid boundaries in the computational domain are specified as viscous walls with no-slip wall boundary condition. Turbulence intensity profile at the exit of turbulence model is shown in Fig. 4. This figure shows the turbulence intensity and which is maximum at the center (30%) and at the walls is around 16-18%, now this profile is incorporated inside the honeycomb as shown in Fig. 2, the profile of turbulence intensity comes out from the honeycomb is shown in Fig. 5. In this profile we can see that the turbulence intensity is reduced from 30% to 1.2% at the center and 16% to 3.5%, it means the honeycomb effectiveness is very high which is around 96%.
Applications
- wind tunnels
- Gas flow
Future scopes
- Use 3D model of honeycomb for better results.
- See results at higher Reynolds Number.
- See results by changing the domain of honeycomb
References
- ↑ ...
- ANSYS Inc., 2007. Release 11 Documentation for ANSYS Workbench.
- Cermak, J.E., 2003. Wind-tunnel development and trends in applications to civil engineering.
- J. Wind Eng. Ind. Aerodyn. 91 (3), 355–370.
- Cermak, J.E., Cochran, L.S., 1992. Physical modeling of the atmospheric surface layer. J. Wind Eng. Ind. Aerodyn. 41–44, 935–946.
- Collar, A.R., 1939. The effect of a gauze on velocity distribution in a uniform duct. Aeronaut. Res. Counc. Rep. Memo No. 1867. Desai, S.S., 2003.
- Relative roles of computational fluid dynamics and wind tunnel testing in the development-of aircraft. Curr. Sci. 84 (1), 49–64.
- Derbunovich, G.I., Zemskaya, A.S., Repik, E.U., Sosedko, Y.P., 1993. Optimum Conditions of Turbulence Reduction with Screens, Mechanics of Nonuniform and Turbulent Flows. Nauka, Moscow, pp. 35.
- Dryden, H.I., Schubauer, G.B., 1947. The use of damping screens for the reduction of wind tunnel turbulence. J. Aeronautical Sci. 14, 221–228.
- Farell, C., Youssef, S., 1996. Experiments on turbulence management using screens and honeycombs. ASME J. Fluids Eng. 118, 26–32.
- Ghani, S.A.A.A., Aroussi, A., Rice, E., 2001. Simulation of road vehicle natural environment in a climatic wind tunnel. Simul. Pract. Theory 8 (6–7), 359–375.
- Gordon, R., Imbabi, M.S., 1998. CFD simulation and experimental validation of a new closed circuit wind/water tunnel design. J. Fluids Eng. Trans. ASME 120 (2), 311–318.
- Groth, J., Johansson, A., 1988. Turbulence reduction by screens. J. Fluids Mech. 197, 139–155.
- Hansen, S.O., Sorensen, E.G., 1985. A new boundary-layer wind tunnel at the Danish Maritime Institute. J. Wind Eng. Ind. Aerodyn. 18, 213–224.


