Engineering:Jitterlyzer
From HandWiki
Short description: Electronic test equipment
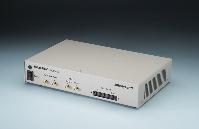
 FS5000 | |
| Date invented | 2007 |
|---|---|
| Invented by | FuturePlus Systems |
| Connects to | Host PC via:
PCIe x1 and x4 via:
SRIO via:
|
The FS5000 Jitterlyzer performs physical layer serial bus jitter evaluation. It can inject controlled jitter and measure the characteristics of incoming jitter. When teamed with a logic analyzer or protocol analyzer, it can correlate these measurements with protocol analysis. Physical-layer tests can be performed while the system under test is processing live bus traffic.[1]
Jitter measurements
The FS5000 measures jitter in two categories:
Timing
There are four different timing measurements:
- Bathtub Plot - The bathtub curve can provide tremendous insight into the BER performance of a link under test. A bathtub curve is obtained by drawing a horizontal line across the waveform under test. The probability distribution function for signal transitions (zero crossings) from a high voltage to a low voltage or a low voltage to a high voltage is then computed. The bathtub curve is useful because it can provide a lot of insight into the behavior of a system. Apart from estimating BER, it also provides an indication for the amount of margin that is in the system. When coupled with protocol testing with the Jitterlyzer, a high margin enables engineers to quickly rule out the physical layer as a potential cause of certain protocol errors.
- Statistics - The Jitterlyzer’s measurement routines uncover total jitter and BER directly (without requiring mathematical extrapolation). This routine for random jitter (RJ) and deterministic jitter (DJ) separation is included for completeness. Also a number is provided for RJ and DJ on real-life traffic.
- Bus View - Shows channel to channel skew of four channels simultaneously.
- Jitter Histogram - This routine is performed on real-life traffic. It selects the zero-crossing voltage in the incoming data. It then counts the number of transitions of the high-speed serial signal as a function of phase positions. A histogram of number of hits versus delay is then plotted.[2]
Eye
There are three different eye measurements
- Eye diagram - This routine is performed on real-life traffic. It provides much more information than just a vertical eye opening or a horizontal eye opening. Instead, it provides a first indication of parameters such as dispersion in the signal path, rise-time issues, etc. Click on the link and you will see an example of an eye diagram that is obtained using the Jitterlyzer. As can be seen, an indication of noise throughout the whole eye is made, as opposed to, for example, only at the center.
- Oscilloscope - This measurement allows the user to see an oscilloscope trace in persistent mode, allowing direct inspection of the eye. Color represents the frequency with which the measured trace passes through each point, with red representing the most frequent, and black representing the least. Note that frequency is normalized to a maximum value of 1.
- Voltage Histogram - This measurement is similar to the jitter histogram except that it is done in the vertical domain. It shows the amount of voltage noise that exists on the high-speed serial signal and is similar in principle to the vertical eye height.[2]
Jitter generation
Data pattern
- LIVE traffic
- Preprogrammed Compliance patterns
Jitter profile
- Frequency range 19.07 kHz - 19.99 MHz
- Amplitude range 40ps - 1200ps
Differential swing
- 400-1600mv[2]
External links
- Jitter analysis tool from FuturePlus Systems.
References
 |
