Engineering:Thermal profiling
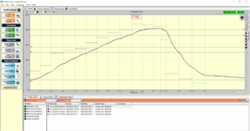
A thermal profile is a complex set of time-temperature data typically associated with the measurement of thermal temperatures in an oven (ex: reflow oven). The thermal profile is often measured along a variety of dimensions such as slope, soak, time above liquidus (TAL), and peak.
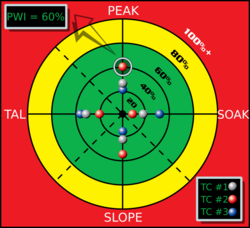
A thermal profile can be ranked on how it fits in a process window (the specification or tolerance limit).[1] Raw temperature values are normalized in terms of a percentage relative to both the process mean and the window limits. The center of the process window is defined as zero, and the extreme edges of the process window are ±99%.[1] A Process Window Index (PWI) greater than or equal to 100% indicates the profile is outside of the process limitations. A PWI of 99% indicates that the profile is within process limitations, but runs at the edge of the process window.[1] For example, if the process mean is set at 200 °C with the process window calibrated at 180 °C and 220 °C respectively, then a measured value of 188 °C translates to a process window index of −60%.
The method is used in a variety of industrial and laboratory processes,[2] including electronic component assembly, optoelectronics,[3] optics,[4] biochemical engineering,[5] food science,[6] decontamination of hazardous wastes,[citation needed] and geochemical analysis.[7]
Soldering of electronic products
One of the major uses of this method is soldering of electronic assemblies. There are two main types of profiles used today: The Ramp-Soak-Spike (RSS) and the Ramp to Spike (RTS). In modern systems, quality management practices in manufacturing industries have produced automatic process algorithms such as PWI, where soldering ovens come preloaded with extensive electronics and programmable inputs to define and refine process specifications. By using algorithms such as PWI, engineers can calibrate and customize parameters to achieve minimum process variance and a near zero defect rate.
Reflow process
In soldering, a thermal profile is a complex set of time-temperature values for a variety of process dimensions such as slope, soak, TAL, and peak.[8] Solder paste contains a mix of metal, flux, and solvents that aid in the phase change of the paste from semi-solid, to liquid to vapor; and the metal from solid to liquid. For an effective soldering process, soldering must be carried out under carefully calibrated conditions in a reflow oven. Convection Reflow Oven Detailed Description
There are two main profile types used today in soldering:
- The Ramp-Soak-Spike (RSS)
- Ramp to Spike (RTS)
Ramp-Soak-Spike
Ramp is defined as the rate of change in temperature over time, expressed in degrees per second.[9]:14 The most commonly used process limit is 4 °C/s, though many component and solder paste manufacturers specify the value as 2 °C/s. Many components have a specification where the rise in temperature should not exceed a specified temperature per second, such as 2 °C/s. Rapid evaporation of the flux contained in the solder paste can lead to defects, such as lead lift, tombstoning, and solder balls. Additionally, rapid heat can lead to steam generation within the component if the moisture content is high, resulting in the formation of microcracks.[9]:16
In the soak segment of the profile, the solder paste approaches a phase change. The amount of energy introduced to both the component and the PCB approaches equilibrium. In this stage, most of the flux evaporates out of the solder paste. The duration of the soak varies for different pastes. The mass of the PCB is another factor that must be considered for the soak duration. An over-rapid heat transfer can cause solder splattering and the production of solder balls, bridging and other defects. If the heat transfer is too slow, the flux concentration may remain high and result in cold solder joints, voids and incomplete reflow.[9]:16
After the soak segment, the profile enters the ramp-to-peak segment of the profile, which is a given temperature range and time exceeding the melting temperature of the alloy. Successful profiles range in temperature up to 30 °C higher than liquidus, which is approximately 183 °C for eutectic and approximately 217 °C for lead-free.[9]:16–17
The final area of this profile is the cooling section. A typical specification for the cool down is usually less than −6 °C/s (falling slope).[9]:17
Ramp-to-Spike
The Ramp to Spike (RTS) profile is almost a linear graph, starting at the entrance of the process and ending at the peak segment, with a greater Δt (change in temperature) in the cooling segment. While the Ramp-Soak-Spike (RSS) allows for about 4 °C/s, the requirements of the RTS is about 1–2 °C/s. These values depend on the solder paste specifications. The RTS soak period is part of the ramp and is not as easily distinguishable as in RSS. The soak is controlled primarily by the conveyor speed. The peak of the RTS profile is the endpoint of the linear ramp to the peak segment of the profile. The same considerations about defects in an RSS profile also apply to an RTS profile.[9]:18
When the PCB enters the cooling segment, the negative slope generally is steeper than the rising slope.[9]:18
Thermocouple attachments
Thermocouples (or TCs) are two dissimilar metals joined by a welded bead. For a thermocouple to read the temperature at any given point, the welded bead must come in direct contact with the object whose temperatures need to be measured. The two dissimilar wires must remain separate, joined only at the bead; otherwise, the reading is no longer at the welded bead but at the position where the metals first make contact, rendering the reading invalid.[9]:20
A zigzagging thermocouple reading on a profile graph indicates loosely attached thermocouples. For accurate readings, thermocouples are attached to areas that are dissimilar in terms of mass, location and known trouble spots. Additionally, they should be isolated from air currents. Finally, the placement of several thermocouples should range from populated to less populated areas of the PCB for the best sampling conditions.[9]:20
Several methods of attachment are used, including epoxy, high-temperature solder, Kapton and aluminum tape, each with various levels of success for each method.[10]
Epoxies are good at securing TC conductors to the profile board to keep them from becoming entangled in the oven during profiling. Epoxies come in both insulator and conductor formulations The specs need to be checked otherwise an insulator can play a negative role in the collection of profile data. The ability to apply this adhesive in similar quantities and thicknesses is difficult to measure in quantitative terms. This decreases reproducibility. If epoxy is used, properties and specifications of that epoxy must be checked. Epoxy functions within a wide range of temperature tolerances.
The properties of solder used for TC attachment differ from that of electrically connective solder. High temperature solder is not the best choice to use for TC attachment for several reasons. First, it has the same drawbacks as epoxy – the quantity of solder needed to adhere the TC to a substrate varies from location to location. Second, solder is conductive and may short-circuit TCs. Generally, there is a short length of conductor that is exposed to the temperature gradient. Together, this exposed area, along with the physical weld produce an Electromotive Force (EMF). Conductors and the weld are placed in a homogeneous environment within the temperature gradient to minimize the effects of EMF.
Kapton tape is one of the most widely used tapes and methods for TC and TC conductor attachment. When several layers are applied, each layer has an additive effect on the insulation and may negatively impact a profile. A disadvantage of this tape is that the PCB has to be very clean and smooth to achieve an airtight cover over the thermocouple weld and conductors. Another disadvantage to Kapton tape is that at temperatures above 200 °C the tape becomes elastic and, hence, the TCs have a tendency to lift off the substrate surface. The result is erroneous readings characterized by jagged lines in the profile.
Aluminum tape comes in various thicknesses and density. Heavier aluminum tape can defuse the heat transfer through the tape and act as an insulator. Low density aluminum tape allows for heat transfer to the EMF-producing area of the TC. The thermal conductivity of the aluminum tape allows for even conduction when the thickness of the tape is fairly consistent in the EMF-producing area of the thermocouple.
Virtual profiling
Virtual profiling is a method of creating profiles without attaching the thermocouples (TCs) or having to physically instrument a PCB each and every time a profile is run for the same production board. All the typical profile data such as slope, soak, TAL, etc., that are measured by instrumented profiles are gathered by using virtual profiles. The benefits of not having attached TCs surpass the convenience of not having to instrument a PCB every time a new profile is needed.
Virtual profiles are created automatically, for both reflow or wave solder machines. An initial recipe setup is required for modeling purposes, but once completed, profiling can be made virtual. As the system is automatic, profiles can be generated periodically or continuously for each and every assembly. SPC charts along with CpK can be used as an aid when collecting a mountain of process-related data. Automated profiling systems continuously monitor the process and create profiles for each assembly. As barcoding becomes more common with both reflow and wave processes, the two technologies can be combined for profiling traceability, allowing each generated profile to be searchable by barcode. This is useful when an assembly is questioned at some time in the future. As a profile is created for each assembly, a quick search using the PCB’s barcode can pull up the profile in question and provide evidence that the component was processed in spec. Additionally, tighter process control can be achieved when combining automated profiling with barcoding, such as confirming that the correct process has been input by the operator before launching a production run.[11] [12]
External links
- Automatic Profiling video
- Different levels of reflow profile control
- Example Thermal Profiler
- Automatic Profiling Walkthrough
- Profile Simulation Software
References
- ↑ 1.0 1.1 1.2 "A Method for Quantifying Thermal Profile Performance". KIC Thermal. Archived from the original on 2011-07-13. https://web.archive.org/web/20110713145755/http://kicthermal.com/products/solar-industry.html?page=shop.product_details&flypage=flypage.tpl&category_id=6&product_id=16&vmcchk=1. Retrieved 2010-09-30.
- ↑ Pearce, Ray "Process improvement through thermal profiling: the goal of thermal profiling is to always increase quality and reduce waste. Three case histories--covering powder coating, baking and solder reflow applications " Process Heating, 01-JAN-05 [1]
- ↑ "High performance thermal profiling of photonic integrated circuits"
- ↑ Kapusta, Evelyn (2005), Using Thermal Profiling to Monitor Optical Feedback in Semiconductor Lasers, https://ida.mtholyoke.edu/xmlui/handle/10166/719
- ↑ K. Gill, M. Appleton and G. J. Lye "Thermal profiling for parallel on-line monitoring of biomass growth in miniature stirred bioreactors" Biotechnology Letters Volume 30, Number 9 / September, 2008 [2]
- ↑ B. Strahm & B, Plattner, "Thermal profiling: Predicting processing characteristics of feed materials:" [3]
- ↑ Arehart, Greg B.; Donelick, Raymond A. (2006). "Thermal and isotopic profiling of the Pipeline hydrothermal system: Application to exploration for Carlin-type gold deposits". Journal of Geochemical Exploration 91 (1–3): 27–40. doi:10.1016/j.gexplo.2005.12.005. ISSN 0375-6742.
- ↑ Houston, Paul N; Brian J. Louis. "Taking the Pain Out of Pb-free Reflow". Lead-Free Magazine. p. 3. http://www.leadfreemagazine.com/pages/pdf/pain_out_of_reflow.pdf. Retrieved 2008-12-10.
- ↑ 9.0 9.1 9.2 9.3 9.4 9.5 9.6 9.7 9.8 O'Leary, Brian; Michael Limberg (2009). Profiling Guide. DiggyPod. ISBN 978-0-9840903-0-3.
- ↑ TC Attachment Methods "[4]"
- ↑ Automatic Profiling video (Video). KIC Thermal.
- ↑ Archived at Ghostarchive and the Wayback Machine: Solderstar Automatic Profiling Systems (APS ) - CONTINUOUS MONITORING FOR REFLOW SOLDERING. YouTube.
 |


