File:Australian radiogenic granite and sedimentary basin geothermal hot rock potential map - GA10333.pdf
From HandWiki
Size of this JPG preview of this PDF file: 800 × 566 pixels. Other resolution: 640 × 453 pixels.
Original file (7,018 × 4,966 pixels, file size: 9.27 MB, MIME type: application/pdf)
Summary
| Description |
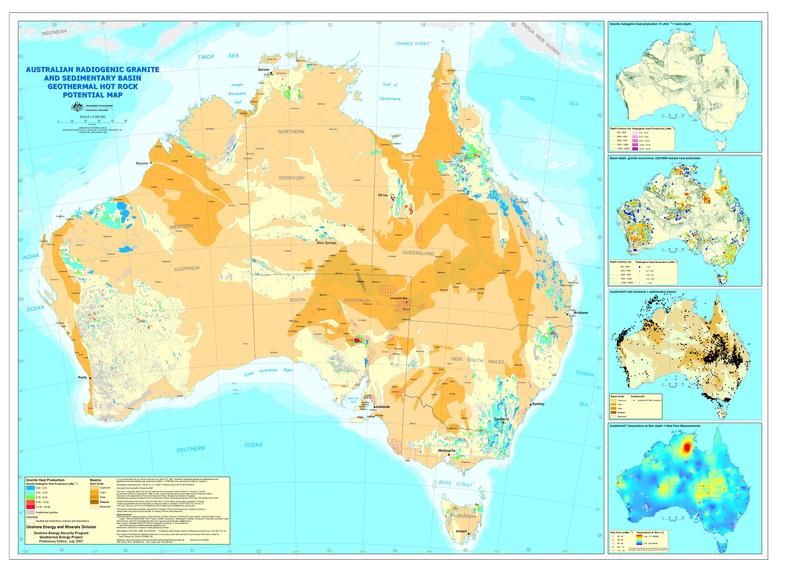
English: Australian radiogenic granite and sedimentary basin geothermal hot rock potential map. The hot rock geothermal model in the Australian context comprises high-heat producing granites overlain by thick accumulations of low-thermal conductivity sediments. The granites have low concentrations of radiogenic elements, and over hundreds of millions of years, these elements decay and produce heat. The passage of this heat to the Earth's surface via upwards conduction is slowed by layers of sediments that have low thermal conductivity, creating 'hot spots' beneath the blankets. This thematic map shows granites attributed by heat production and basin depth. The majority of the granites depicted are of surface outcrop. The presence of high-heat producing granites adjacent to deep sedimentary basins may be used as a first-order indicator of where to further investigate the possibility of hot rock geothermal plays.
The main frame of the map shows all granites (attributed by calculated heat production - where available), sedimentary basins (and their order e.g. where one basin is overlapped by another) and geothermal licences and applications. The top right inset map shows only those granites with a calculated radiogenic heat generation of >5 uW -3, with the depth of the sedimentary basins. This map provides a rapid view of areas that may be expected to have the greatest hot rock potential. The second-from-top inset map shows all suitable geochemical analyses from OZCHEM, attributed by calculated radiogenic heat generation. This shows both the distribution of data that goes into attributing the granite polygons, and also analyses of granites (and other rocks) that fall outside the mapped granite polygons that are otherwise excluded from the main map. The third-from-top inset map shows the distribution of drillholes with temperature measurements. The bottom inset map shows an image of the Austherm07 database, which is derived from the drillhole temperature information. The image shows the projected temperature of the crust at a depth of 5 kilometres, interpolated between the drillholes. Overlain on this image is the small number of publicly-available heat flow data. |
| Date | |
| Source | https://www.ga.gov.au/products/servlet/controller?event=GEOCAT_DETAILS&catno=65306 (Direct) |
| Author | Geoscience Australia (senior author Budd, A.R.) |
Licensing
This file is licensed under the Creative Commons Attribution 3.0 Australia license.
Attribution: Geoscience Australia
- You are free:
- to share – to copy, distribute and transmit the work
- to remix – to adapt the work
- Under the following conditions:
- attribution – You must give appropriate credit, provide a link to the license, and indicate if changes were made. You may do so in any reasonable manner, but not in any way that suggests the licensor endorses you or your use.

This file, which was originally posted to
ga.gov.au, was reviewed on 15 October 2013 by reviewer Bobamnertiopsis, who confirmed that it was available there under the stated license on that date.
|
File history
Click on a date/time to view the file as it appeared at that time.
| Date/Time | Thumbnail | Dimensions | User | Comment | |
|---|---|---|---|---|---|
| current | 02:28, 12 September 2013 |  | 7,018 × 4,966 (9.27 MB) | imagescommonswiki>99of9 | User created page with UploadWizard |
File usage
The following file is a duplicate of this file (more details):
The following 3 pages use this file:

