Finance:Alpha Indexes
Nasdaq OMX Alpha Indexes measure the relative performance of an underlying stock or exchange-traded fund (ETF) against another benchmark[1] ETF using a proprietary calculation. The first component in the index is the “Target Component”, such as Apple (AAPL), and the second component is identified as a “Benchmark Component”, such as the S&P 500 ETF (SPY).
The Nasdaq OMX Alpha Indexes were developed by Jacob S. Sagi and Robert E. Whaley, both professors at the Owen Graduate School of Management, Vanderbilt University. They published a research paper “Trading Relative Performance with Alpha Indexes”[2] in the November/ December 2011 issue of Financial Analysts Journal detailing the concept behind Alpha Indexes.
Nasdaq OMX launched the live calculation and dissemination of Alpha Indexes on October 11, 2010.[3] The Alpha Indexes were set at 100.00 as of January 1, 2010.[4] Thus each disseminated index depicts a target component’s return performance versus its benchmark since January 1, 2010. For example, the Alpha Index for AAPL with SPY as the benchmark, which trades under the symbol AVSPY, had a level of 199.91 on 11/09/12.[5] This means that over the period between 1/1/2010 until 11/09/2012 an investment in AAPL outperformed an investment in SPY by +99.91%
Relative Performance Indexes
A general prescription for investors without a strong knowledge about the performance of individual stocks is to invest in a well-diversified portfolio, reallocate wealth occasionally to reflect risk tolerance, and avoid market timing. But many stock portfolio managers are "stock-pickers" and/or "asset allocators" as they attempt to find underpriced and overpriced stocks and/or asset classes that will beat a well-diversified benchmark. Thus investment management requires comparing the performance of individual securities and security portfolio relative to each other. The indirect method to trade relative performance is "pairs trading" which requires having a long/ short position in a stock and short/ long position in the market, or buying call and put options in the stock and the market. For example, if an investor believes that AAPL will outperform the market, he/ she will buy the stock and sell the market. But this position could result in unlimited downside with the investor losing money on both the stock and the market. To limit this downside, the investor could instead buy a call on the stock and a put on the market, but this would require unnecessary payment for the market volatility embedded in the stock option premium. A better and cost-effective way is to trade relative performance directly using an index which measures the total return performance of a target security relative to that of a benchmark like the S&P 500.
List of Alpha Indexes
Alpha Indexes currently listed at NASDAQ are as given below.[6]
| NASDAQ OMX Alpha Index Pair | Index and Trading Symbol | Options Available |
|---|---|---|
| AAPL vs. SPY | AVSPY | Y |
| AMZN vs. SPY | AMZSY | N |
| CSCO vs. SPY | CSCSY | N |
| C vs. XLF | CVXLF | N |
| DIA vs. SPY | DIASY | N |
| EEM vs. SPY | EEMSY | N |
| EWJ vs. SPY | EWJSY | N |
| EWZ vs. SPY | EWZSY | N |
| F vs. SPY | FRDSY | N |
| FXI vs. SPY | FXISY | N |
| GE vs. SPY | GESPY | Y |
| GLD vs. SPY | GLDSY | N |
| GOOG vs. SPY | GOOSY | Y |
| HPQ vs. SPY | HPQSY | N |
| IBM vs. SPY | IBMSY | Y |
| INTC vs. SPY | INTSY | Y |
| IWM vs. SPY | IWMSY | N |
| KO vs. SPY | KOSPY | N |
| MSFT vs. SPY | MSFSY | N |
| MRK vs. SPY | MRKSY | Y |
| OIL vs. SPY | OILSY | N |
| ORCL vs. SPY | ORCSY | N |
| PFE vs. SPY | PFESY | N |
| QQQ vs. SPY | QQQSY | N |
| RIMM vs. SPY | RIMSY | N |
| SLV vs. SPY | SLVSY | N |
| SPY vs. GLD | SPYGD | N |
| T vs. SPY | ATTSY | N |
| TGT vs. SPY | TGTSY | N |
| TLT vs. SPY | TLTSY | N |
| VZ vs. SPY | VZSPY | N |
| WMT vs. SPY | WMTSY | Y |
| XLE vs. SPY | XLESY | N |
| XLF vs. SPY | XLFSY | N |
Calculation of Alpha Indexes
The total daily return of a stock is defined as:
where, is target security price at end of day t, and is the dividend paid by the security during day t.
The total daily benchmark return is defined similarly:
The daily updating formula for a relative performance index is defined as:
where, b is a relative risk-adjustment coefficient.
For NASDAQ OMX Alpha Indexes that are currently trading, b=1, and the relative performance index can be viewed as an outperformance index. Moreover, in practice the updating takes place continuously rather than once a day.
An important feature of Alpha Indexes is the incorporation of dividends in its calculation. This gives a more accurate and factual relative performance of the target security with respect to the benchmark. It also puts all the securities on an equal footing, as a non dividend security has an unfair advantage in terms of price performance over a dividend paying security. This feature is not available for many other indices (e.g., the S&P 500 index does not factor in the reinvestment of dividends and thus only includes price appreciation or, in other words, capital gains).
- Example 1
- AVSPY,[7] the index for relative performance of AAPL against SPY, is at 100.00 at the start of the month. If after one day, AAPL has a return +10% and SPY is +6%, the index will increase with a relative factor of 1.10/1.06 = 1.0377. Thus AVSPY will be 103.77 at the end of day one. It doesn't matter what is the direction of return for the stock and benchmark, as long as stock performs better than the benchmark the relative index will increase.
- Example 2
- GOOSY,[8] the index for relative performance of Google (GOOG) against SPY is at 120.00. If returns on GOOG is +5% and SPY is +10%, the index decreases with the factor 1.05/1.10 = 0.9545 . Thus the index will be 120 * 0.9545 = 114.54 finally.
Index Slippage
Investors might view Alpha Indexes as a measure of numerical difference between the returns of the target and the benchmark component. It is important to note that the percentage increase in the index over a period, say a day, is only approximately equal to the difference between the returns of the target and its benchmark. The extent to which this approximation fails is called “slippage”.
- Example
- As given in the example above, AAPL rose by +10% and the SPY by +6%. Thus the difference between the returns of AAPL and SPY is 4%. But the index increases by a factor of 1.10/1.06 = 1.0377, i.e. 3.77%. Thus the Index slippage is equivalent to 4-3.77 = 0.23%.
- Similarly in the other example, the difference in the returns of GOOG and SPY is -5%. But the GOOSY decreases by a factor of 0.9545, i.e. -4.55%. Therefore the Index slippage in this case would be (-5%)-(-4.55%) = -0.45%.
Alpha Index Options

Alpha Index options began trading on the NASDAQ OMX PHLX on April 18, 2011 with the launch of contracts on AVSPY. As of September 26, 2011 options on seven indexes trade. If an investor is long an AVSPY call option, he/ she would benefit if returns on APPL are better than returns on SPY. If the investor is long a put option on AVSPY, he/ she would gain if AAPL underperforms SPY.
Alpha Index volatility
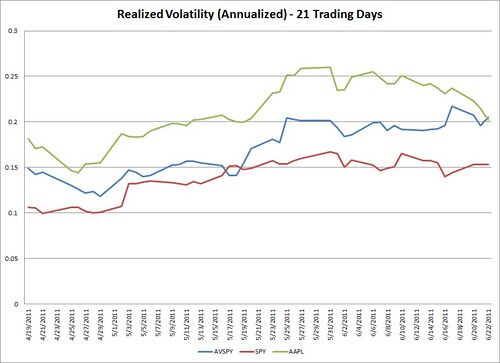
Alpha indexes were designed to reduce the amount of market risk in a stock. This will generally be true if the market beta of the target is greater than one half (which is true of the “typical stock”). If AAPL and SPY have a high degree of correlation, the relative performance index will not be as volatile as the underlying stock. Consequently, volatility for AVSPY would be lower than that for AAPL. This also implies that AVSPY options are cheaper than AAPL options.
On the other hand, if a stock and its benchmark are poorly correlated, the respective returns will move independently. This could result in a relative performance index that is more volatile than the target. In such a case the Alpha Index option would be more expensive than a plain option on the target.
Contract Specifications for NASDAQ OMX Alpha Index Options
These are all European-style options which trade only at NASDAQ OMX PHLX. The settlement is by cash, so there is no delivery of any asset apart from cash on expiration. The last trading day is the last business day (usually Thursday) before the third Friday of the expiration month, and the expiration date is the Saturday following the third Friday of the expiration month.[9]
Estimating and trading correlation
The volatility of an Alpha Index depends on the volatilities of underlying stock and the benchmark market and their correlation:
where
- is correlation between stock and benchmark market,
- is target stock volatility,
- is benchmark market volatility, and
- b=1 for currently traded NASDAQ OMX Alpha Indexes.

This formula can in turn be used to compute the implied correlation of the target with the benchmark as follows. If the target and benchmark volatilities can be accurately estimated using volatilities implied by the prices of options on the securities, then the option prices on the alpha index would imply the correlation between the target and the benchmark. This gives researchers a tool to calculate forward looking implied estimate of the correlation between target and market and the beta of the target security.
The ability to estimate implied correlation also allows investors to trade correlation. As discussed earlier a higher (lower) correlation implies low (high) volatility of alpha index and hence low (high) option prices. Consequently, if an investor believes the correlation will increase (decrease), he/ she can sell (buy) index call options to gain profits. Thus estimating market expectations of correlation of stocks can help investors to hedge their risk in the long term.
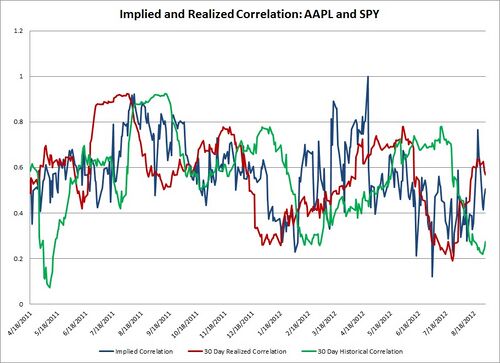
The historical correlation between AAPL and SPY with a look-back period of 30-Days and Implied correlation based on AVSPY option prices during the period April 18, 2011 to August 30, 2012 are plotted below.
The correlation between AVSPY Realized Volatility for 21 Trading days and Implied Correlations between AAPL and SPY during the period April 19, 2011 to August 14, 2012 is 0.234 approximately, while the correlation between AVSPY Realized volatility and Historical Correlation during the same period is approximately 0.043. This suggests that implied correlations appears to be better predictors of realized volatility than an estimate of historical correlations.
References
- ↑ "Benchmark Definition". http://www.investopedia.com/terms/b/benchmark.asp#axzz2Bz212Knq. Retrieved 12 November 2012.
- ↑ Sagi, Jacob S.; Whaley, Robert E. (12 May 2011). Trading Relative Performance with Alpha Indexes.
- ↑ "NASDAQ OMX Launches Innovative Alpha Indexes(TM)". http://ir.nasdaqomx.com/releasedetail.cfm?ReleaseID=525264.
- ↑ "Alpha FAQs". http://www.nasdaqtrader.com/content/phlx/AlphaFAQs.pdf. Retrieved 14 November 2012.
- ↑ "AVSPY Historical Prices - Google Finance". https://www.google.com/finance/historical?q=INDEXNASDAQ%3AAVSPY&ei=S9ujUNj_O52UlwOCrwE. Retrieved 10 November 2012.
- ↑ "NASDAQ OMX Alpha Indexes". http://www.nasdaqtrader.com/Micro.aspx?id=Alpha.
- ↑ "NASDAQ OMX Indexes AVSPY". https://indexes.nasdaqomx.com/Data.aspx?IndexSymbol=AVSPY.
- ↑ "NASDAQ OMX Indexes GOOSY". https://indexes.nasdaqomx.com/Data.aspx?IndexSymbol=GOOSY.
- ↑ "Alpha Contract Specifications". http://www.nasdaqtrader.com/Micro.aspx?id=alphacontractspecs.
