Finance:List of E.U. metropolitan areas by GDP
From HandWiki
Short description: Wikipedia list article
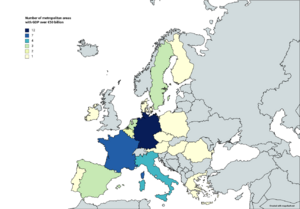
A metropolitan region's gross domestic product, or GDP, is one of several measures of the size of its economy. Similar to GDP, GMP is defined as the market value of all final goods and services produced within a metropolitan area in a given period of time. In this case the statistics of Eurostat's[1] Urban Audit for Larger Urban Zones have been used.
2018/2019
| Rank | Metro Area | Gross Metropolitan Product (in billions EUR)[2] |
Year |
|---|---|---|---|
| 1 | 742.0 | 2018[3] | |
| 2 | 231.1 | 2018 | |
| 3 | 213.8 | 2018 | |
| 4 | 194.9 | 2018 | |
| 5 | 193.3 | 2018 | |
| 6 | 182.7 | 2018 | |
| 7 | 171.4 | 2018 | |
| 8 | 168.4 | 2018 | |
| 9 | 165.3 | 2018 | |
| 10 | 162.7 | 2018 | |
| 11 | 159.2 | 2018 | |
| 12 | 155.7 | 2018 | |
| 13 | 152.2 | 2018 | |
| 14 | 147.8 | 2018 | |
| 15 | 147.7 | 2019 | |
| 16 | 134.9 | 2019 | |
| 17 | 132.2 | 2018 | |
| 18 | 101.2 | 2018 | |
| 19 | 97.9 | 2018 | |
| 20 | 91.7 | 2018 | |
| 21 | 89.5 | 2018 | |
| 22 | 88.8 | 2018 | |
| 23 | 86.3 | 2018 | |
| 24 | 84.9 | 2018 | |
| 25 | 81.9 | 2018 | |
| 26 | 81.6 | 2018 | |
| 27 | 81.5 | 2018 | |
| 28 | 79.2 | 2018 | |
| 29 | 75.7 | 2018 | |
| 30 | 73.6 | 2018 | |
| 31 | 71.9 | 2018 | |
| 32 | 69.4 | 2019 | |
| 33 | 65.9 | 2018 | |
| 34 | 60.3 | 2018 | |
| 35 | 59.1 | 2018 | |
| 36 | 59.0 | 2018 | |
| 37 | 58.8 | 2018 | |
| 38 | 57.0 | 2018 | |
| 39 | 56.8 | 2018 | |
| 40 | 55.2 | 2018 | |
| 41 | 54.6 | 2018 | |
| 42 | 54.0 | 2018 | |
| 43 | 53.6 | 2019 | |
| 44 | 51.1 | 2018 | |
| 45 | 49.9 | 2018 | |
| 46 | 49.1 | 2018 | |
| 47 | 43.6 | 2018 | |
| 48 | 43.3 | 2018 | |
| 49 | 43.0 | 2018 | |
| 50 | 42.1 | 2018 |
See also
- List of cities by GDP
- List of European countries by GDP (nominal)
- Gross metropolitan product
- Nomenclature of Territorial Units for Statistics
- List of metropolitan areas in Europe by population
- List of metropolitan areas (LUZ) in the European Union
- List of the largest urban areas of the European Union
References
- ↑ "Archived copy". Archived from the original on 24 November 2013. https://web.archive.org/web/20131124191101/http://epp.eurostat.ec.europa.eu/portal/page/portal/region_cities/city_urban/data_cities/database_sub1. Retrieved 2014-09-19. European Commission, Regions and cities Database
- ↑ "Gross domestic product (GDP) at current market prices by metropolitan regions". https://ec.europa.eu/eurostat/databrowser/view/met_10r_3gdp/default/table?lang=en.
- ↑ https://ec.europa.eu/eurostat/web/national-accounts/data/database
External links
- City statistics – Urban audit data collection, Eurostat, European Commission (in German, English, and French)
- Eurostat regional European GRP statistics


