Geometric phase analysis

Geometric phase analysis is a method of digital signal processing used to determine crystallographic quantities such as d-spacing or strain from high-resolution transmission electron microscope images.[1][2] The analysis needs to be performed using specialized computer program.
Principle
In geometric phase analysis, local changes in the periodicity of a high resolution image of a crystalline material are quantified, resulting in a two-dimensional map. Quantities which can be mapped with geometric phase analysis include interplanar distances (d-spacing), two-dimensional deformation and strain tensors and displacement vectors. This allows strain fields to be determined at very high resolution, down to the unit cell of the material. Importantly, GPA performed on images that have sub unit-cell resolution can produce erroneous results. For example, a change in composition may appear as a component of the deformation tensor, with the result that an interface appears to have a strain field associated with it when in fact there is none.[3]
Since the calculations are performed in the frequency domain, the input image, with a periodicity of the crystal lattice, must be transformed into a spatial frequency representation using a 2D Fourier transform. From a mathematical point of view, the frequency image is a complex matrix with a size equal to the original image. From a crystallographic point of view, there is an analogy between the 2D Fourier transform and diffraction pattern and the reciprocal lattice. The intensity peaks (or power peaks) in the Fourier transform correspond to crystallographic planes depicted in the original image, specifically a sine wave with the orientation and period of the corresponding planes. A change in the phase of this sine wave indicates a change in the position of its peaks and troughs, which can be interpreted as a component of a 2D deformation tensor.
Due to the complex nature of the frequency image, it can be used to calculate amplitude and phase. Together with a vector of one crystallographic plane depicted in the image, the amplitude and phase can be used to generate a 2D map of d-spacing.[1] If two vectors of non-parallel planes are known, the method can be used to generate maps of strain and displacement.[2]
Software
In order to perform geometric phase analysis, a computer tool is needed. Firstly, because manual evaluation of transforms between spatial and frequential domain would be highly impractical. Secondly, a vector of crystallographic plane is an important input parameter and the analysis is sensitive to the accuracy of its localization. Therefore, the accuracy and repeatability of the analysis requires precise localization of diffraction spots.
The required functionalities are available in several software packages including Strain++[4] and the crystallographic suite CrysTBox. The latter offers an interactive geometric phase analysis called gpaGUI. In both packages it is possible to locate peaks in the Fourier transform with sub-pixel precision (e.g. diffractGUI).[5]
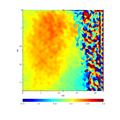
- High-resolution image of magnesium processed with geometric phase analysis.
-
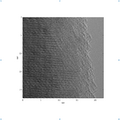 Input image (magnesium)
 -
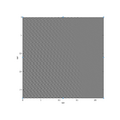 Filtered image of plane (0 1 0)
 -
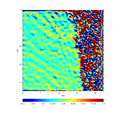 Map of (0 1 0) d-spacing
 -
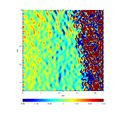 Map of XX component of strain tensor
 -
 Map of X component of displacement vector


See also
- High-resolution transmission electron microscopy
- Fourier transform
- Transmission electron microscope
- CrysTBox
References
- ↑ 1.0 1.1 Hÿtch, M.J. (1997). "Geometric phase analysis of high resolution electron microscope images". Scanning Microscopy 11: 53–66.
- ↑ 2.0 2.1 Hÿtch, M.J.; Snoeck, E.; Kilaas, R. (1998). "Quantitative measurement of displacement and strain fields from HREM micrographs". Ultramicroscopy (Elsevier BV) 74 (3): 131–146. doi:10.1016/s0304-3991(98)00035-7. ISSN 0304-3991.
- ↑ Peters, Jonathan JP (2015). "Artefacts in geometric phase analysis of compound materials". Ultramicroscopy 157: 91-97. doi:10.1016/j.ultramic.2015.05.020.
- ↑ Peters, Jonathan JP. "Strain++". https://jjppeters.github.io/Strainpp/.
- ↑ Klinger, Miloslav (2017-07-07). "More features, more tools, more CrysTBox". Journal of Applied Crystallography (International Union of Crystallography (IUCr)) 50 (4): 1226–1234. doi:10.1107/s1600576717006793. ISSN 1600-5767.
| Basics | |||||||
|---|---|---|---|---|---|---|---|
| Electron interaction with matter | |||||||
| Instrumentation | |||||||
| Microscopes |
| ||||||
| Techniques |
| ||||||
| Others |
| ||||||
 |  |
