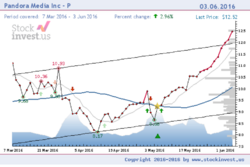
Golden Star (technical analysis)
Golden Star is a technical signal used in technical analysis of stock prices charts that first was introduced in 2007 by J. Stromberg at the website getagraph.com. The signal derives from the well known Golden Cross that uses the 200 days moving average and the 50 days moving averages to define what has been argued by many to be the best technical signal of them all. Some, however, disagree, and as late as in April 2016 Kate Rooney publish the article "Don't trust the Dow's 'golden cross': Belski", at CNN (Kate Rooney, 2016) where Belski states.[1]
The Golden Star signal differs from the Golden Cross by adding more conditions. The moving averages has to be selected based on the time frame selected. In addition, it has to cross the price line at a given pattern as shown below.
Notes
- Golden cross a bullish cross of the 50-day and 200-day moving averages NASDAQ Financial Glossary
- Death cross a bearish cross of the 50-day and 200-day moving averages NASDAQ Financial Glossary
- Moving average crossover
References
- ↑ Rooney, Kate. "Don't trust the Dow's 'golden cross': Belski". https://www.cnbc.com/2016/04/20/dont-trust-the-dows-golden-cross-belski.html. Retrieved 7 June 2016.


