Medicine:Multiple deprivation index
Indices of multiple deprivation (IMD) are widely-used datasets within the UK to classify the relative deprivation (essentially a measure of poverty) of small areas. Multiple components of deprivation are weighted with different strengths and compiled into a single score of deprivation.
The calculation and publication of the indices is devolved and indices of multiple deprivation for Wales, Scotland, England, and Northern Ireland are calculated separately. While the components of deprivation that make up the overall deprivation score are similar in all four nations of the UK the weights assigned to each component, the size of the geographies for which deprivation scores are calculated, and the years of calculation are different. As a result levels of deprivation cannot be easily compared between nations.
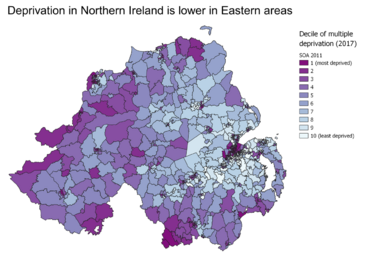
The geography at which IMDs are produced varies across the nations of the UK and has varied over time. Currently the smallest geography for which IMDs are published is LSOA level in both England and Wales, data zone level for Scotland, and Super Output Area (SOA) for Northern Ireland. Early versions of the English IMDs were published at electoral ward and English local authority level.
The use of IMDs in social analysis aims to balance the desire for a single number describing the concept of deprivation in a place and the recognition that deprivation has many interacting components. IMDs may be an improvement over simpler measures of deprivation such as low average household disposable income because they capture variables such as the advantage of access to a good school and the disadvantage of exposure to high levels of air pollution. A potential disadvantage is that the choice of components and the weighting of those components in the construction of the overall multiple deprivation score is unavoidably subjective.
Components of deprivation
In the current English Indices of Deprivation 2019 (IoD2019) seven domains of deprivation are considered and weighted as follows,
- Income. (22.5%)
- Employment. (22.5%)
- Education. (13.5%)
- Health. (13.5%)
- Crime. (9.3%)
- Barriers to Housing and Services. (9.3%)
- Living Environment. (9.3%)
These domains each have multiple components. For example the Barriers to Housing and Services considers seven components including levels of household overcrowding, homelessness, housing affordability, and the distance by road to four types of key amenity (post office, primary school, supermarket, and GP surgery).
Cases for indexes of multiple deprivation at larger and smaller geographies
IMDs are calculated separately for England, Wales, Scotland, and Northern Ireland and are not comparable across them. While the geographies, the input measures, and the weights assigned to each input measure are different in all four countries, they are similar enough to calculate a combined UK IMD with only small sacrifices in data quality. Decisions within the UK that are taken nationally would be usefully informed by a UK index of multiple deprivation and this work has been proven possible and performed.[1] The most recent whole-UK index of multiple deprivation was compiled by MySociety in 2021.[2]
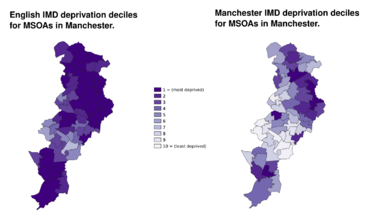
There are also examples of IMDs being created for smaller geographies within nations. This is particularly important in places with very high deprivation in almost all areas. For example, using English IMDs in Manchester is not useful for targeting local interventions since over half of the city is classed as being in England's most deprived decile. By using raw deprivation scores before they are ranked, a local IMD can be calculated showing relative deprivation within a place instead of its relative deprivation within England.
Applicability of IMDs to the analysis of very diverse areas
IMDs are the property of an area and of the average characteristics of the people living in that area. They are not the property of any single person living within the area. Failure by researchers to consider this can lead to misleading features in analysis based on IMDs. This is a particularly large risk in areas which are very diverse due to social housing and mixed community policies such as central London. In these settings, a mixed community with a mix of very low income families in poor health and very high income families in good health can return a middling IMD score that represents neither group well and fails to provide useful insight to users of analysis based on IMD data. Other groups not well represented by IMDs are mobile communities and people experiencing homelessness, some of the most deprived members of society.[3]
Responsibility for production
Responsibility for the production of publication of IMDs varies by the nation that they cover. Northern Ireland Statistics and Research Agency (NISRA) publishes IMDs for Northern Ireland. StatsWales publishes IMDs for Wales. The Scottish Government publishes IMDs for Scotland. The UK Ministry of Housing, Communities and Local Government (MHCLG) publishes IMDs for England.
Early version of English IMDs were produced by the Social Disadvantage Research Group at the University of Oxford.
List of UK deprivation indexes
The most recent IMDs for the four nations of the UK are,
- Northern Ireland Multiple Deprivation Measure 2017 (NIMDM2017).
- English Indices of Deprivation 2019.
- Scottish Index of Multiple Deprivation (SIMD) 2020.
- Welsh Index of Multiple Deprivation (WIMD) 2019.
Previous versions include,
- English indices of deprivation 2000.
- English indices of deprivation 2004 (ID2004)
- English indices of deprivation 2007 (ID2007)
Other deprivation indexes
Other deprivation indexes, or similar indexes that measure properties of society linked to deprivation, are used for different analysis. Examples include,
- Underprivileged area score
- Carstairs index
- Department of Environment Index
Deprivation indexes in other countries
Equivalents of IMDs outside of the UK include,
- "Socio-Economic Indexes for Areas (SEIFA)". Australian Bureau of Statistics. 27 March 2018. https://www.abs.gov.au/ausstats/abs@.nsf/mf/2033.0.55.001.
- "Indice de défavorisation social" (in French). AtlaSanté. https://www.atlasante.fr/geonetwork/srv/fre/catalog.search#/metadata/8ba3a966-fda5-4147-ba45-f6f9fd899c09.
- The European Deprivation Index[4]
- "The Canadian Index of Multiple Deprivation". The Government of Canada. 12 June 2019. https://www150.statcan.gc.ca/n1/pub/45-20-0001/452000012019002-eng.htm.
- China's county-level area deprivation index (CADI) [5]
- The Swiss neighbourhood index of SEP (Swiss-SEP) [6][7]
- The German Index of Multiple Deprivation (GIMD) [8]
- The Italian deprivation index [9]
- The Area Deprivation Index (ADI).[10][11] US Department of Health and Human Services. September 2022.
References
- ↑ "Adjusted indices of multiple deprivation to enable comparisons within and between constituent countries of the UK including an illustration using mortality rates". BMJ Open 6 (11): e012750. November 2016. doi:10.1136/bmjopen-2016-012750. PMID 27852716.
- ↑ "Unified UK measures of rurality and deprivation" (in en-US). 2021-04-22. https://www.mysociety.org/2021/04/22/unified-uk-measures-of-rurality-and-deprivation/.
- ↑ "If social determinants of health are so important, shouldn't we ask patients about them?". BMJ 371: m4150. 24 November 2020. doi:10.1136/bmj.m4150. PMID 33234506. https://www.bmj.com/content/371/bmj.m4150.long.
- ↑ "European Deprivation Index: designed to tackle socioeconomic inequalities in cancer in Europe.". European Journal of Public Health 28 (suppl_4): cky213-625. November 2018. doi:10.1093/eurpub/cky213.625. https://academic.oup.com/eurpub/article/28/suppl_4/cky213.625/5191925.
- ↑ "Construction of an area-deprivation index for 2869 counties in China: a census-based approach.". J Epidemiol Community Health 75 (2): 114–119. 2021. doi:10.1136/jech-2020-214198. PMID 33037046. https://www.pure.ed.ac.uk/ws/files/179464041/Construction_of_an_area_deprivation_index_for_2869_counties_in_China.pdf.
- ↑ "A Swiss neighbourhood index of socioeconomic position: development and association with mortality.". J Epidemiol Community Health 66 (12): 1129–36. 2012. doi:10.1136/jech-2011-200699. PMID 22717282.
- ↑ "The Swiss neighbourhood index of socioeconomic position: update and re-validation.". Swiss Med Wkly 153 (1): 40028. 2023. doi:10.57187/smw.2023.40028. PMID 36652707.
- ↑ "[Indizes Multipler Deprivation zur Analyse regionaler Gesundheitsunterschiede in Deutschland : Erfahrungen aus Epidemiologie und Versorgungsforschung][Article in German].". Bundesgesundheitsblatt - Gesundheitsforschung - Gesundheitsschutz 60 (12): 1403–12. 2017. doi:10.1007/s00103-017-2646-2. PMID 29119206.
- ↑ "[Aggiornamento e revisione dell'indice di deprivazione italiano 2011 a livello di sezione di censimento][Article in Italian].". Epidemiol Prev 44 (2–3): 162–70. 2020. doi:10.19191/EP20.2-3.P162.039. PMID 32631016.
- ↑ "Neighborhood Atlas - Home" (in en). https://www.neighborhoodatlas.medicine.wisc.edu/.
- ↑ "Landscape of Area-Level Deprivation Measures and Other Approaches to Account for Social Risk and Social Determinants of Health in Health Care Payments" (in en). https://aspe.hhs.gov/reports/area-level-measures-account-sdoh.
 |


