Physics:Shelf-break front
Shelf-Break Fronts are a process by which stratification of the water column occurs. This stratification normally results in thermoclines, since they occur where a sudden change in water depth causes a constriction of the current flow. They can be expressed as a ratio of their potential energy due to maintaining mixed (non-stratified) conditions, to the dissipated energy produced by the current being forced across the sudden change in depth. This can be expressed as:
The energy terms can be expressed in very detailed equations, but with constant terms factored out, the important terms are water velocity (average velocity, ) and water depth (h). The equation for the stratification index can be expressed as:
Where is a friction coefficient, approximated as 0.003 for a sandy bottom. This index can be calculated for any coastal region, usually in the range of +3 (highly stratified) to -2 (highly turbulent).
Reason to calculate
The stratification index for a Shelf Break Front is an indication of how productive phytoplankton will be. When the stratification index is approximately 1.5, this produces a nutrient-rich environment for the growth of phytoplankton. Too much higher, and the stratification of the water column will not cause the upwellings of nutrients needed for the phytoplankton to prosper, too much lower, and the water will be too turbulent for the phytoplankton to use the nutrients available. Stability of the front, in addition to nutrients,[2] is a key to phytoplankton production. An illustration of the stratification index for Narragansett Bay is shown here, with the average speeds estimated, using actual bathymetry for the bay, and an estimated for silt, which composes much of the bay's bottom. Using the Stokes Spreadsheet,[3] and some customization on the size of silt particles, I used a = 0.0011. More accurate speed measurements and detailed values for the Bay's bottom could yield a higher fidelity image.
-
![Narragansett Bay Bathymetry (Data Source[4])](/wiki/images/thumb/4/47/NarragansettBayBathymetry.png/600px-NarragansettBayBathymetry.png) Narragansett Bay Bathymetry (Data Source[4])
Narragansett Bay Bathymetry (Data Source[4]) -
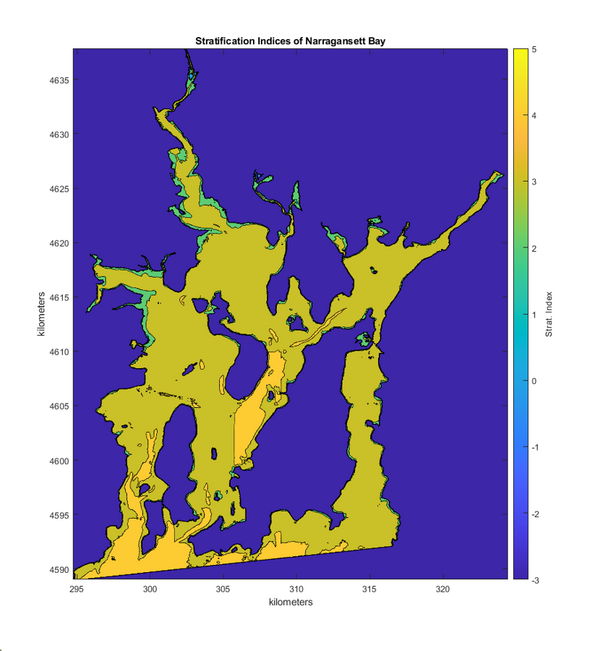 Narragansett Bay Stratification Index
![Narragansett Bay Bathymetry (Data Source[4])](/wiki/File:NarragansettBayBathymetry.png)

Notice the green color (a stratification index of approximately 1.5) along the edges of the Northern Bay and near some of the islands. These areas are favorable to the formation of algal blooms in the Narraganset Bay habitat due to the stratification index being approximately 1.5. Algae have been observed in high concentration in some of these areas, but not all of them.
Using flow cytometry, results [5] have determined that the relative abundance of picophytoplankton (< 2 m), small nanophytoplankton (2 to 10 m) and large nanophytoplankton (10-20 m) are greatly affected by the stratification index of the water column. Cell diversity was greatest in the presence of moderate levels of stratification. If the turbulence is too high, their numbers remain stable or fall, but if there is no turbulence, their numbers do fall. It is postulated that the nutrient-rich boundary layer around each phytoplankton cell is not exhausted, but renewed, by this moderate level of turbulence.[2]
References
- ↑ 1.0 1.1 Carol Lalli and Timothy R. Parsons, 1997, Biological Oceanography: An Introduction, 2nd Ed., Elsevier Butterworth-Heinemann, Oxford, UK, 337 pp.
- ↑ 2.0 2.1 K.H.Mann and J.R.N. Lazier, 2006, Dynamics of Marine Ecosystems, 3rd Ed., Blackwell Publishing Oxford, UK, 591 pp.
- ↑ Stokes Law, https://web.viu.ca/earle/geol201/stokes-law.xls, 23 Sep 2020
- ↑ Narragansett Bay, RI (M020) Bathymetric Digital Elevation Model (30 meter resolution) Derived From Source Hydrographic Survey Soundings Collected by NOAA,https://www.ngdc.noaa.gov/thredds/fileServer/regional/narragansett_bay_m020_30m.nc, 6 June 2020
- ↑ Li, W.K.W., 2002, Macroecological patterns of phytoplankton in the northwestern North Atlantic Ocean., Nature 419, 154-157
 |  |
