Scaleogram
From HandWiki

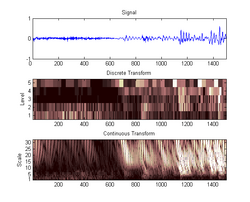
In signal processing, a scaleogram or scalogram is a visual method of displaying a wavelet transform. There are 3 axes: x representing time, y representing scale, and z representing coefficient value. The z axis is often shown by varying the colour or brightness.
A scaleogram is the equivalent of a spectrogram for wavelets, and can be used for estimation of instantaneous frequency.[1]
See also
References
- ↑ Sejdic, E.; Djurovic, I.; Stankovic, L. (August 2008). "Quantitative Performance Analysis of Scalogram as Instantaneous Frequency Estimator". IEEE Transactions on Signal Processing 56 (8): 3837–3845. doi:10.1109/TSP.2008.924856. ISSN 1053-587X. http://ieeexplore.ieee.org/document/4511413/.
