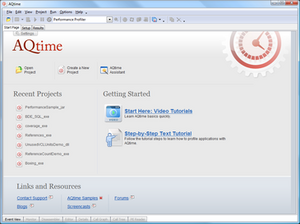
Software:AQtime
 | |
 | |
| Original author(s) | AutomatedQA |
|---|---|
| Developer(s) | SmartBear Software |
| Initial release | Script error: No such module "Date time". |
| Stable release | 8.20
/ February 25, 2014 |
| Available in | English |
| License | Proprietary |
| Website | smartbear |
AQtime is a performance profiler and memory/resource debugging toolset developed by SmartBear Software. It is integrated into Microsoft Visual Studio, Visual Studio Test Projects, and Embarcadero RAD Studio, which allows analyzing the application without leaving the development environment.[1][2][3][4]
Overview
AQtime is used for multiple optimization tasks to improve application performance and memory usage. It includes a set of profilers for the analysis of different application aspects. It does sophisticated application performance analysis of function execution time down to the individual source code lines. It tracks performance issues and memory leaks. It analyzes resource usage and function call order. It monitors code coverage, Windows API compliance and includes other profilers for analyzing more application properties.
Features
- Support for Windows and .NET compilers.[5]
- Support for profiling 32- and 64-bit applications.
- Profiling Java and Silverlight Applications.
- Profiling scripts.
- Integration into Microsoft Visual Studio and Embarcadero RAD Studio IDEs.[6][7]
Awards
- Software Development Jolt Awards presented by Software Development magazine:[8] 2006
- Delphi Informant Readers Choice Awards as the Best in the Debugging Tool category: 2004, 2003
- asp.netPRO Readers' Choice Awards:[9] 2005
- The Best in the .NET Profiler category .NET Developer's Journal's Readers' Choice Awards:[10] 2004
See also
- Software optimization
- Performance analysis
- List of performance analysis tools
- Debugger
- Memory debugger
References
- ↑ "AQTime Pro – Memory and Performance Profiling Tool for Mission Critical Code". http://smartbear.com/products/development-tools/performance-profiling/.
- ↑ "Visual Studio Marketplace". http://visualstudiogallery.msdn.microsoft.com/en-us/CCC997FA-25A6-4F14-8433-393D463F2687.
- ↑ "AQTime Pro – Memory and Performance Profiling Tool for Mission Critical Code". http://smartbear.com/products/development-tools/performance-profiling/visual-studio-integration/.
- ↑ "AQTime Pro – Memory and Performance Profiling Tool for Mission Critical Code". http://smartbear.com/products/development-tools/performance-profiling/rad-studio-integration/.
- ↑ "AQTime Pro – Memory and Performance Profiling Tool for Mission Critical Code". http://smartbear.com/products/development-tools/performance-profiling/supported-dev-tools/.
- ↑ "AQtime 7.0 Pro Runtime Analysis Software Released". Dr.Dobb's. 2010-09-01. http://www.drdobbs.com/windows/aqtime-70-pro-runtime-analysis-software/227200126?queryText=AQtime. Retrieved 2013-04-02.
- ↑ "SmartBear AQtime Pro Brings Advanced Application Profiling To Win8, VS 2012". Tools Journal. 2013-04-02. http://www.toolsjournal.com/integrations-articles/item/1557-smartbear-aqtime-pro-brings-adv-profilingen. Retrieved 2013-04-05.
- ↑ "2006 Jolt Awards". http://www.ddj.com/architect/187900423.
- ↑ "Home". http://www.aspnetpro.com/.
- ↑ CloudEXPO ®
External links
 |
