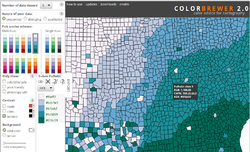
Software:ColorBrewer

ColorBrewer is an online tool for selecting map color schemes based on color palettes invented by Cynthia Brewer.[1] It was launched in 2002 and is licensed using Apache 2.0 software license, which is similar to CC-BY-SA 3.0.[2] Suggested color schemes are based on the data type, such as sequential, diverging, or qualitative.
Brewer palettes
Valid names and a full color representation for each palette are shown below. If this is viewed in a compliant browser, moving the mouse cursor over each box will pop up the corresponding color number as a tooltip.
Applications
In 2018, climate scientist Ed Hawkins chose the eight most saturated blues and reds from the ColorBrewer 9-class single-hue palettes in his design of warming stripes graphics, which visually summarize global warming as an ordered sequence of stripes.[3]
See also
References
- ↑ Miller, Greg. "The Cartographer Who's Transforming Map Design". https://www.wired.com/2014/10/cindy-brewer-map-design/.
- ↑ Harrower, Mark; Brewer, Cynthia A. (2003), "ColorBrewer.org: An Online Tool for Selecting Colour Schemes for Maps", The Cartographic Journal 40 (1): 27–37, doi:10.1179/000870403235002042, http://www.albany.edu/faculty/fboscoe/papers/harrower2003.pdf, retrieved 2013-01-03
- ↑ Bugden, Erica (3 December 2019). "Do you really understand the influential warming stripes?". https://www.chezvoila.com/blog/warmingstripes.
External links


