Software:ParaView
 | |
 Paraview 5.0 | |
| Developer(s) | Sandia National Laboratories, Kitware Inc, Los Alamos National Laboratory |
|---|---|
| Stable release | 5.13
/ August 22, 2024[1] |
| Preview release | nightly
/ September 2, 2024[1] |
| Repository | Paraview Repository |
| Written in | C, C++, Fortran, Python |
| Operating system | Unix/Linux, macOS, Microsoft Windows |
| Type | Scientific visualization, Interactive visualization |
| License | 3-clause BSD |
| Website | www.paraview.org |
ParaView is an open-source multiple-platform application for interactive, scientific visualization. It has a client–server architecture to facilitate remote visualization of datasets, and generates level of detail (LOD) models to maintain interactive frame rates for large datasets. It is an application built on top of the Visualization Toolkit (VTK) libraries. ParaView is an application designed for data parallelism on shared-memory or distributed-memory multicomputers and clusters. It can also be run as a single-computer application.
Summary
ParaView is an open-source, multi-platform data analysis and visualization application. ParaView is known and used in many different communities to analyze and visualize scientific data sets.[2] It can be used to build visualizations to analyze data using qualitative and quantitative techniques. The data exploration can be done interactively in 3D or programmatically using ParaView's batch processing capabilities.[3]
ParaView was developed to analyze extremely large datasets using distributed memory computing resources. It can be run on supercomputers to analyze datasets of terascale as well as on laptops for smaller data.[3]
ParaView is an application framework as well as a turn-key application. The ParaView code base is designed in such a way that all of its components can be reused to quickly develop vertical applications. This flexibility allows ParaView developers to quickly develop applications that have specific functionality for a specific problem domain.
ParaView runs on distributed and shared memory parallel and single processor systems. It has been successfully tested on Windows, macOS, Linux, IBM Blue Gene, Cray Xt3 and various Unix workstations, clusters and supercomputers. Under the hood, ParaView uses Visualization Toolkit (VTK) as the data processing and rendering engine and has a user interface written using Qt.
The goals of the ParaView team include the following:
- Develop an open-source, multi-platform visualization application.
- Support distributed computation models to process large data sets.
- Create an open, flexible, and intuitive user interface.
- Develop an extensible architecture based on open standards.
History
The ParaView project started in 2000[4] as a collaborative effort between Kitware, Inc. and Los Alamos National Laboratory through funding provided by the US Department of Energy ASCI Views program. The first public release was announced in October 2002.
Independent of ParaView, Kitware developed a web-based visualization system in December 2001. This project was funded by Phase I and II SBIRs from the US Army Research Laboratory and eventually became the ParaView Enterprise Edition. PVEE significantly contributed to the development of ParaView's client/server architecture.
In September 2005, Kitware, Sandia National Labs and CSimSoft (now Coreform LLC) started the development of ParaView 3.0.[5] ParaView 3.0 was released in May 2007. In June 2013, ParaView 4.0 was released, this version was based on VTK 6.0.[6] Version 5.0 was released in January 2016, this version included a new rendering back-end.[7]
Features
Visualization capabilities
- Handles structured (uniform rectilinear, non-uniform rectilinear, and curvilinear grids), unstructured, polygonal, image, multi-block and AMR data types.
- All processing operations (filters) produce datasets. This allows the user to either further process the result of every operation or the results as a data file. For example, the user can extract a cut surface, reduce the number of points on this surface by masking and apply glyphs (i.e. vector arrows) to the result.
- Vectors fields can be inspected by applying glyphs (arrows, cones, lines, spheres, and various 2D glyphs) to the points in a dataset. The glyphs can be scaled by scalars, vector component or vector magnitude and can be oriented using a vector field.
- Contours and isosurfaces can be extracted from all data types using scalars or vector components. The results can be colored by any other variable or processed further. When possible, structured data contours/isosurfaces are extracted with fast and efficient algorithms which make use of the efficient data layout.
- A sub-region of a dataset can be extracted by cutting or clipping with an arbitrary plane (all data types), specifying a threshold criteria to exclude cells (all data types) and/or specifying a VOI (volume of interest - structured data types only).
- Streamlines can be generated using constant step or adaptive integrators. The results can be displayed as points, lines, tubes, ribbons, etc., and can be processed by a multitude of filters. Particle paths can be extracted from temporal datasets.
- The points in a dataset can be warped (displaced) with scalars (given a user defined displacement vector) or with vectors (unavailable for non-linear rectilinear grids).
- With the array calculator, new variables can be computed using existing point or cell field arrays. A multitude of scalar and vector operations are supported.
- Advanced data processing can be done using the Python Programmable filter with VTK, NumPy, SciPy and other Python modules.
- Data can be probed at a point or along a line. The results are displayed either graphically or as text and can be exported for further analysis. Data can also be extracted over time (including statistical information such as minimum, maximum and standard deviation).
- Data can be inspected quantitatively using the powerful selection mechanism and the spreadsheet view: The selection mechanism allows the user to focus on an important subset of a dataset using either interactive selection by picking a point or selecting a rectangular area as well quantitative selection mechanisms.
- The spreadsheet view allows the user to inspect either the whole dataset or the selected subset as raw numbers.
- ParaView provides many other data sources and filters by default. Any VTK source or filter can be added by providing a simple XML description.
Input/output and file format
- Supports a variety of file formats including: VTK (new and legacy, all types including parallel, ASCII and binary, can be read and written).
- EnSight 6 and EnSight Gold (all types including parallel, ASCII and binary; multiple parts are supported -each part is loaded separately and can be processed individually) (read only).
- CGNS (support for multiple blocks, unsteady solutions and mesh deformation, based on HDF5 low level format) (read only).
- Various polygonal file formats including STL and BYU (by default, read only, other VTK writers can be added by writing XML description).
- Many other file formats are supported.
- Any VTK source or filter can be added by providing a simple XML description (VTK provides many readers).
- Since ParaView is open source, the user can provide their own readers and writers.
User interaction
- Intuitive and flexible interface based on the Qt application framework.
- Allows changing the parameters of many filters by directly interacting with the 3D view using 3D widgets (manipulators). For example, the user can manipulate the seed line of a streamline filter by clicking on a control point and dragging the line to the new location.
- Compact user interface design. By default, all important tools are located in the main window. This eliminates the need for large number of windows which are often difficult to locate on a cluttered desktop. It is also possible to shear off inspectors from the main window.
- Maintains interactive frame rates even when working with large data through the use of level-of-detail (LOD) models. The user determines the threshold (number of points) beyond which a reduced version of the model is displayed during interaction (the size of the model can also be adjusted). Once the interaction is over, the large model is rendered.
Large data and distributed computing
- Runs parallel on distributed and shared memory systems using MPI. These include workstation clusters, visualization systems, large servers, supercomputers, etc.
- The user interface is run on separate computer using the client/server mode.
- ParaView uses the data parallel model in which the data is broken into pieces to be processed by different processes. Most of the visualization algorithms function without any change when running in parallel. ParaView also supports ghost levels used to produce piece invariant results. Ghost levels are points/cells shared between processes and are used by algorithms which require neighborhood information.
- Supports both distributed rendering (where the results are rendered on each node and composited later using the depth buffer), local rendering (where the resulting polygons are collected on one node and rendered locally) and a combination of both (for example, the level-of-detail models can be rendered locally whereas the full model is rendered in a distributed manner). This provides scalable rendering for large data without sacrificing performance when working with smaller data.
- Distributed rendering and tiled-display is done using Sandia's Ice-T library.
Scripting and extensibility
- ParaView is fully scriptable using the simple but powerful Python language. ParaView's data engine, called server manager, is fully accessible through the Python interface. All changes made to the engine through Python are automatically reflected to the user interface.
- ParaView can be run as a batch application using the Python interface. It has been successfully run on supercomputers including IBM Blue Gene and Cray Xt3 using the batch mode.[8]
- Distributed data processing can be done in Python using the Python Programmable Filter. This filter functions seamlessly with NumPy and SciPy.
- Additional modules can be added by either writing an XML description of the interface or by writing C++ classes. The XML interface allows users/developers to add their own VTK filters to ParaView without writing any special code and/or re-compiling.[9][10]
ParaView in use
- In 2005 Sandia National Laboratories, Nvidia and Kitware had multiple press releases on the scalable visualization and rendering work done on ParaView. The releases announced breakthroughs in scalable performance attaining rendering rates of over 8 billion polygons per second using ParaView.[11]
- ParaView is used as the visualization platform for the Modeling software OpenFOAM.[12]
- University of North Carolina at Chapel Hill course 'Visualization on the Sciences' covers ParaView.[13]
- The National Center for Computational Sciences at Oak Ridge National Laboratory uses ParaView for visualizing large datasets.[8]
- SimScale uses ParaView as an alternative to its integrated post-processing environment and is offering several tutorials and webinars on post-processing with ParaView.[14][15][16]
- The FEATool Multiphysics simulation toolbox features one-click export to ParaView Glance interactive web plots.[17]
- The PeriLab Peridynamics simulation uses the Exodus interface visualising large scale models.[18]
-
 Global seismic wave propagation simulation
 -
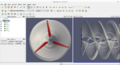 Vortex visualization
 -
 ParaView: viewing a world map
 -
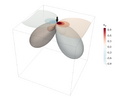 Displacement in the x direction due to a unit point force placed on top of a half space
 -
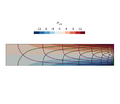 Axial stress for a cantilever beam


See also
References
- ↑ 1.0 1.1 "Tags · ParaView / ParaView · GitLab". https://gitlab.kitware.com/paraview/paraview/-/tags.
- ↑ Niklas Röber (August 6, 2014). Paraview Tutorial for Climate Science. DKRZ, Deutsches Klimarechenzentrum. http://mms.dkrz.de/pdf/vis/paraview.pdf. Retrieved March 8, 2016.
- ↑ 3.0 3.1 Utkarsh Ayachit (January 22, 2015). The ParaView Guide: A Parallel Visualization Application. Kitware, Inc.. ISBN 978-1930934306. http://www.paraview.org/paraview-downloads/download.php?submit=Download&version=v5.0&type=data&os=all&downloadFile=ParaViewGuide-CE-v5.0.0.pdf. Retrieved March 8, 2016.
- ↑ Kitware (March 10, 2000). "Kitware Signs Contract to Develop Parallel Processing Tools". http://www.kitware.com/news/home/browse/85.
- ↑ Kitware (March 13, 2007). "ParaView III Alpha Release". https://blog.kitware.com/paraview-iii-alpha-release/.
- ↑ Kitware (June 17, 2013). "ParaView 4.0.1 available for download". https://blog.kitware.com/paraview-4-0-1-available-for-download-2/.
- ↑ Kitware (January 12, 2016). "ParaView 5.0.0 available for download". https://blog.kitware.com/paraview-5-0-0-available-for-download/.
- ↑ 8.0 8.1 National Center for Computational Sciences at Oak Ridge National Laboratory (January 16, 2016). "Running ParaView on Titan". https://www.olcf.ornl.gov/tutorials/running-paraview-on-titan/.
- ↑ Kitware (November 13, 2015). "ParaView/Plugin HowTo". http://www.paraview.org/Wiki/Plugin_HowTo.
- ↑ Kitware (August 22, 2012). "ParaView/Extending ParaView at Compile Time". http://www.paraview.org/Wiki/Extending_ParaView_at_Compile_Time.
- ↑ David Higham (March 17, 2005). "Sandia National Labs Achieves Breakthrough Performance Using NVIDIA Technology for Scientific Visualization". http://www.nvidia.com/object/IO_27539.html.
- ↑ OpenCFD Ltd (ESI Group) (January 13, 2016). "OpenFOAM® v3.0+: New Post-processing Functionality". http://www.openfoam.com/version-v3.0+/post-processing.php.
- ↑ Russell Taylor. "Comp/Phys/Mtsc 715, Visualization in the Sciences". http://cs.unc.edu/~taylorr/Comp715.
- ↑ "Post-processing via 3rd-party solution — SimScale Documentation" (in en). https://www.simscale.com/docs/content/postprocessing/local-postprocessing.html.
- ↑ SimScale GmbH (2016-03-08), Webinar | Online Post-Processing with SimScale, https://www.youtube.com/watch?v=0D7kmZ0EpB0, retrieved 2018-01-15
- ↑ "Post-Processing with ParaView for Formula Student" (in en-US). SimScale. https://www.simscale.com/webinars-workshops/post-processing-paraview-formula-student/.
- ↑ "FEATool Multiphysics ParaView Glance Examples Gallery" (in en). https://www.featool.com/paraview-glance.
- ↑ "PeriLab results created with PeriHub" (in en). https://www.youtube.com/@PeriHub.
External links
- Paraview's use in different areas
- ParaView Gallery
- ParaView Publications
- Flickr page of Paraview visualizations
- Kitware videos on Vimeo
 |  |
