Software:VisiData
| Original author(s) | Saul Pwanson |
|---|---|
| Initial release | July 30, 2017 |
| Stable release | 2.10.2
/ October 8, 2022 |
| Written in | Python |
| Operating system | MacOS, Windows, Linux |
| Type | Data analysis |
| License | GNU General Public License v3.0 |
| Website | https://www.visidata.org/ |
VisiData is a free, open-source data analyzing tool, developed by Saul Pwanson. Allowing quick access to datasets via the terminal, VisiData features quick summarizing and analyzing capabilities,[1] and is oriented to explore data without building heavy-weight process on top of it.[2] VisiData supports tabular datasets in formats such as tsv, csv, sqlite, json, xlsx (Excel), hdf5, and many other.[3] It also supports data structures such as pandas DataFrames.[4] The tool is intended mainly to assist in the EDA (exploring data analysis) stage.[5]
First presented in November 2016, VisiData was described by its author, Saul Pwanson, as "A Swiss Army Chainsaw for Data". Implying it fits mostly for quick data assignments and checks, on rather small-medium datasets, as oppose to "heavier" data analyzing tools and engines which can handle complex analysis or heavier datasets.
VisiData is written in Python.[6]
Key Features
Navigation

The key navigation features offered by VisiData focus on quick navigate, select, edit, and search keyboard shortcuts. For example, pressing "|" or "\" will select/unselect (respectively) rows matching regex inserted by the user in current column, while the short commands, "g|" and "g\" will perform the same operation on all rows. Another example is select/unselect current row pressing "t".
Data Analysis
VisiData allows aggregating selected data using "+" key. It supports basic aggregation functions such as "sum", "count", as well as statistical aggregation function such as "median" and "stdev" (standard deviation). Moreover, VisiData allows pivoting table by setting a key column using the key "!".
In addition, VisiData has a shortcut for viewing a visual histogram of an aggregated column (shift+"f").
Creating graphs is also possible by selecting two columns, while columns will be displayed as "x" and "y" axis.
Data Scraping
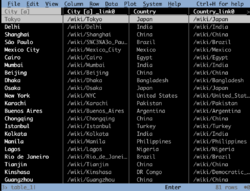
VisiData allows scraping HTML table data from a webpage tables using a simple command, and treats these tables as if they were any other data tables. For example, the CLI command "vd https://en.wikipedia.org/wiki/List_of_largest_cities" will open the wikipedia largest cities table as a VisiData dataset.
References
- ↑ "An Introduction to VisiData — An Introduction to VisiData". https://jsvine.github.io/intro-to-visidata/index.html.
- ↑ "Data Engineering Annotated Monthly – November 2021 | The Big Data Tools Blog" (in en-US). https://blog.jetbrains.com/big-data-tools/2021/12/07/data-engineering-annotated-monthly-november-2021/.
- ↑ khuyentran1476 (2022-09-23). "VisiData: A terminal interface for exploring and arranging tabular data" (in en-US). https://mathdatasimplified.com/2022/09/23/visidata-a-terminal-interface-for-exploring-and-arranging-tabular-data/.
- ↑ "10 Ways to Use VisiData" (in en). https://www.visidata.org/blog/2020/ten/.
- ↑ "Best Libraries That Will Assist You In EDA: 2021 Edition | HackerNoon" (in en). https://hackernoon.com/best-libraries-that-will-assist-you-in-eda-2021-edition-2l1734hl.
- ↑ Krčmář, Petr. "Správce hesel BitWarden, servery bez serverů a moderní řádka" (in cs). https://www.root.cz/clanky/spravce-hesel-bitwarden-servery-bez-serveru-a-moderni-radka/.
