Reconstruction from Projections
}}
The problem of reconstructing a multidimensional signal from its projection is uniquely multidimensional, having no 1-D counterpart. It has applications that range from computer-aided tomography to geophysical signal processing. It is a problem which can be explored from several points of view—as a deconvolution problem, a modeling problem, an estimation problem, or an interpolation problem.[1][2]
Motivation and applications
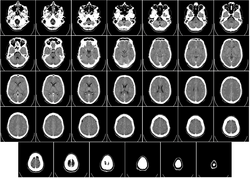
The problem of reconstruction form projections has arisen independently in a large number of scientific fields, since it is widely applied in areas such as medical imaging, geophysical tomography, industrial radiography and so on. For example, by using CT scanner, the lesion information of the patients can be presented in 3D on the computer, which offers a new and accurate approach in diagnosis and thus has vital clinical value.
Problem statement and basics
A projection is a linear mapping of an [math]\displaystyle{ M }[/math] dimensional signal into an [math]\displaystyle{ N }[/math] dimensional one, where [math]\displaystyle{ N\leq M }[/math]. And the objective of reconstruction is to restore the [math]\displaystyle{ M }[/math] dimensional signal based on the [math]\displaystyle{ N }[/math] dimensional signal. The following case is a 2-D signal projected into 1D signal.[3] The signal in the original coordinate is denoted as [math]\displaystyle{ d(u,v) }[/math]. Now consider a collimated beam of radiation coming from the opposite orientation of [math]\displaystyle{ \hat{v} }[/math], producing a projection along [math]\displaystyle{ \hat{u} }[/math]. [math]\displaystyle{ \hat{v} }[/math] and [math]\displaystyle{ \hat{u} }[/math] are normal to each other, and the angle between [math]\displaystyle{ u }[/math] and [math]\displaystyle{ \hat{u} }[/math] is theta. The signal obtained along [math]\displaystyle{ \hat{u} }[/math] axis is defined to be [math]\displaystyle{ p_\theta(\hat{u}) }[/math]. The relationship between the original coordinate and the rotated coordinate is given by
[math]\displaystyle{ \begin{bmatrix} \hat{u}\\ \hat{v} \end{bmatrix} = \begin{bmatrix} \cos\theta & \sin\theta\\ -\sin\theta & \cos\theta \end{bmatrix} \begin{bmatrix} u\\ v \end{bmatrix} }[/math]
or inversely,
[math]\displaystyle{ \begin{bmatrix} u\\ v \end{bmatrix} = \begin{bmatrix} \cos\theta & -\sin\theta\\ \sin\theta & \cos\theta \end{bmatrix} \begin{bmatrix} \hat{u}\\ \hat{v} \end{bmatrix} }[/math]
Then we have
[math]\displaystyle{ p_\theta(\hat{u})=\int_{-\infty}^{\infty} d(u,v)\, \mathrm{d}\hat{v} =\int_{-\infty}^{\infty} d(\hat{u}\cos(\theta)-\hat{v}\sin(\theta),\hat{u}\sin(\theta)+\hat{v}\cos(\theta))\, \mathrm{d}\hat{v} }[/math]
By varying theta, a large number of projections can be obtained.
Given the projection-slice theorem, [math]\displaystyle{ D(\Omega,\theta) }[/math],the slice of the Fourier transform of [math]\displaystyle{ d(u,v) }[/math] at angle theta, is equivalent to [math]\displaystyle{ P_\theta(\Omega) }[/math], the Fourier Transform of the projection [math]\displaystyle{ p_\theta(\hat{u}) }[/math]. Therefore, the unknown [math]\displaystyle{ d(u,v) }[/math] can be obtained from its Fourier transform by means of the Fourier transform inversion integral
[math]\displaystyle{ \mathrm{d}(u,v)=\frac{1}{4\pi^2}\int_{-\infty}^{\infty}\int_{-\infty}^{\infty}D(\Omega_1,\Omega_2)e^{j\Omega_1 u} e^{j\Omega_2 v}\,\mathrm{d}\Omega_1,\Omega_2 }[/math] [math]\displaystyle{ =\frac{1}{4\pi^2}\int_{0}^{\infty}\int_{-\pi}^{\pi}D(\Omega,\theta)e^{j\Omega u \cos(\theta)} e^{j\Omega vsin\theta}\begin{vmatrix}\Omega\end{vmatrix}\,\mathrm{d}\Omega\mathrm{d}\theta }[/math] [math]\displaystyle{ =\frac{1}{4\pi^2}\int_{-\pi}^{\pi}\int_{0}^{\infty}P_\theta(\Omega)e^j\Omega(u\cos\theta+v\sin\theta)\begin{vmatrix}\Omega\end{vmatrix}\,\mathrm{d}\Omega\mathrm{d}\theta }[/math] [math]\displaystyle{ =\frac{1}{4\pi^2}\int_{0}^{\pi}(\int_{-\infty}^{\infty}P_\theta(\Omega)\begin{vmatrix}\Omega\end{vmatrix} }[/math] [math]\displaystyle{ e^{j\Omega\hat{u}}\mathrm{d}\Omega)\mathrm{d}\theta }[/math]
By taking the inverse Fourier Transform and assuming [math]\displaystyle{ g(\hat{u})=\mathcal{F}^{-1}({\begin{vmatrix}\Omega\end{vmatrix}^2}) }[/math], we get [math]\displaystyle{ d(u,v)=\sum_i \vartriangle \theta_i [p_\theta(\hat{u})*g_{\theta i}(\hat{u})] }[/math]
Approaches
In practice, there are a wide rarity of methods that are utilized, most of which are reconstruct 3-D information (volume) from 2-D signals (image). Typically used methods are CT, MRI, PET and SPECT. And the filtered back projection based on the principles introduced above are commonly applied.[4][5]
Computed Tomography (CT)
In CT, a volume is formed by stacking the axial slices. The software cuts the volume in a different plane (usually orthogonal). Commonly, slice data is generated using an X-ray source that rotates around the object. X-ray sensors are positioned on the opposite side of the circle from the X-ray source.
Magnetic resonance imaging (MRI)
In MRI, energy from an oscillating magnetic field is temporarily applied to the patient at the appropriate resonance frequency. The protons (hydrogen atoms) emit a radio frequency signal which is measured by a receiving coil. The radio signal can be made to encode position information by varying the main magnetic field using gradient coils.[6]
Positron emission tomography (PET)
The system detects pairs of gamma rays emitted indirectly by a positron-emitting radionuclide (tracer), which is introduced into the body on a biologically active molecule. Three-dimensional images of tracer concentration within the body are then constructed by computer analysis. In modern PET-CT scanners, three dimensional imaging is often accomplished with the aid of a CT X-ray scan performed on the patient during the same session, in the same machine.
Single-photon emission computed tomography (SPECT)
SPECT imaging is performed by using a gamma camera to acquire multiple 2-D images (projections) from multiple angles. Multiple projections are used to yield a 3-D data set. This data set may then be manipulated to show thin slices along any chosen axis of the body. SPECT is similar to PET in its use of radioactive tracer material and detection of gamma rays, while the tracers used in SPECT emit gamma radiation that is measured more directly.[7]
See also
- 3D scanner
- filtered back projection
- Algebraic Reconstruction Technique
- 3D data acquisition and object reconstruction
References
- ↑ Dudgeon, Dan E., and Russell M. Mersereau. "Multidimensional digital signal processing." Prentice-Hall Signal Processing Series, Englewood Cliffs: Prentice-Hall, 1984 1 (1984).
- ↑ Gonnor, Ricrrann, and Gabor T. Herman. "Three-dimensional reconstruction from projections: a review of algorithms." International Review of Cytology 38 (1974): 111.
- ↑ Dudgeon, Dan E., and Russell M. Mersereau. "Multidimensional digital signal processing." Prentice-Hall Signal Processing Series, Englewood Cliffs: Prentice-Hall, 1984 1 (1984).
- ↑ Doi, Kunio. "Computer-aided diagnosis in medical imaging: historical review, current status and future potential." Computerized medical imaging and graphics 31.4 (2007): 198-211.
- ↑ Ledley, Robert S., and William R. Ayers. "Computerized Medical Imaging and Graphics." (1995).
- ↑ Schultz, Gerrit, et al. "MR image reconstruction from generalized projections." Magnetic Resonance in Medicine 72.2 (2014): 546-557.
- ↑ Budinger, T. F. "Single photon emission computed tomography." Diagnostic nuclear medicine. Second edition. 1988.
External links
- http://www.tecn.upf.es/~afrangi/ibi/reconstruction_color_2.pdf
- http://opax.swin.edu.au/~dliley/lectures/het408/backproj.pdf


