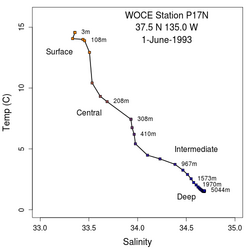
Physics:Temperature–salinity diagram
In oceanography, temperature-salinity diagrams, sometimes called T-S diagrams, are used to identify water masses. In a T-S diagram, rather than plotting each water property as a separate "profile," with pressure or depth as the vertical coordinate, potential temperature (on the vertical axis) is plotted versus salinity (on the horizontal axis). As long as it remains isolated from the surface, where heat or fresh water can be gained or lost, and in the absence of mixing with other water masses, a water parcel's potential temperature and salinity are conserved. Deep water masses thus retain their T-S characteristics for long periods of time, and can be identified readily on a T-S plot.[1][2]
Temperature and salinity combine to determine the potential density of seawater; contours of constant potential density are often shown in T-S diagrams.
References
- ↑ Tomczak. "Water Masses in shallow seas". http://www.es.flinders.edu.au/~mattom/ShelfCoast/notes/chapter10.html. Retrieved 14 November 2012.
- ↑ "Density: sea water mixing and sinking". http://aquarius.nasa.gov/pdfs/seawater_mix_sink.pdf. Retrieved 14 November 2012.
 |


