Short description: Climate characterised by long, usually very cold winters, and short, cool summers
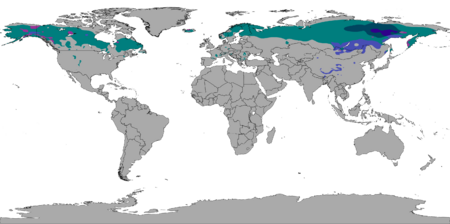
Subarctic climate worldwide
The subarctic climate (also called subpolar climate, or boreal climate) is a continental climate with long, cold (often very cold) winters, and short, warm to cool summers. It is found on large landmasses, often away from the moderating effects of an ocean, generally at latitudes from 50°N to 70°N, poleward of the humid continental climates. Subarctic or boreal climates are the source regions for the cold air that affects temperate latitudes to the south in winter. These climates represent Köppen climate classification Dfc, Dwc, Dsc, Dfd, Dwd and Dsd.
Description
This type of climate offers some of the most extreme seasonal temperature variations found on the planet: in winter, temperatures can drop to below −50 °C (−58 °F) and in summer, the temperature may exceed 26 °C (79 °F). However, the summers are short; no more than three months of the year (but at least one month) must have a 24-hour average temperature of at least 10 °C (50 °F) to fall into this category of climate, and the coldest month should average below 0 °C (32 °F) (or −3 °C (27 °F)). Record low temperatures can approach −70 °C (−94 °F).[1]
With 5–7 consecutive months when the average temperature is below freezing, all moisture in the soil and subsoil freezes solidly to depths of many feet. Summer warmth is insufficient to thaw more than a few surface feet, so permafrost prevails under most areas not near the southern boundary of this climate zone. Seasonal thaw penetrates from 2 to 14 ft (0.6 to 4.3 m), depending on latitude, aspect, and type of ground.[2] Some northern areas with subarctic climates located near oceans (southern Alaska, the northern fringe of Europe, Sakhalin Oblast and Kamchatka Oblast), have milder winters and no permafrost, and are more suited for farming unless precipitation is excessive. The frost-free season is very short, varying from about 45 to 100 days at most, and a freeze can occur anytime outside the summer months in many areas.
Description
The first D indicates continentality, with the coldest month below 0 °C (32 °F) (or −3 °C (27 °F)).
The second letter denotes precipitation patterns:
- s: A dry summer—the driest month in the high-sun half of the year (April to September in the Northern Hemisphere, October to March in the Southern Hemisphere) has less than 30 millimetres (1.18 in)/40 millimetres (1.57 in) of rainfall and has exactly or less than 1⁄3 the precipitation of the wettest month in the low-sun half of the year (October to March in the Northern Hemisphere, April to September in the Southern Hemisphere),
- w: A dry winter—the driest month in the low-sun half of the year has exactly or less than one‑tenth of the precipitation found in the wettest month in the summer half of the year,
- f: No dry season—does not meet either of the alternative specifications above; precipitation and humidity are often high year-round.
The third letter denotes temperature:
- c: Regular subarctic, only one–three months above 10 °C (50.0 °F), coldest month between 0 °C (32 °F) (or −3 °C (27 °F)) and −38 °C (−36.4 °F).
- d: Severely cold subarctic, only one–three months above 10 °C (50.0 °F), coldest month at or below −38 °C (−36.4 °F).
Precipitation
Most subarctic climates have little precipitation, typically no more than 380 mm (15 in) over an entire year due to the low temperatures and evapotranspiration. Away from the coasts, precipitation occurs mostly in the summer months, while in coastal areas with subarctic climates the heaviest precipitation is usually during the autumn months when the relative warmth of sea vis-à-vis land is greatest. Low precipitation, by the standards of more temperate regions with longer summers and warmer winters, is typically sufficient in view of the very low evapotranspiration to allow a water-logged terrain in many areas of subarctic climate and to permit snow cover during winter.
A notable exception to this pattern is that subarctic climates occurring at high elevations in otherwise temperate regions have extremely high precipitation due to orographic lift. Mount Washington, with temperatures typical of a subarctic climate, receives an average rain-equivalent of 101.91 inches (2,588.5 mm) of precipitation per year.[3] Coastal areas of Khabarovsk Krai also have much higher precipitation in summer due to orographic influences (up to 175 millimetres (6.9 in) in July in some areas), whilst the mountainous Kamchatka peninsula and Sakhalin island are even wetter, since orographic moisture isn't confined to the warmer months and creates large glaciers in Kamchatka. Labrador, in eastern Canada, is similarly wet throughout the year due to the semi-permanent Icelandic Low and can receive up to 1,300 millimetres (51 in) of rainfall equivalent per year, creating a snow cover of up to 1.5 metres (59 in) that does not melt until June.
Vegetation and land use
Vegetation in regions with subarctic climates is generally of low diversity, as only hardy tree species can survive the long winters and make use of the short summers. Trees are mostly limited to conifers, as few broadleaved trees are able to survive the very low temperatures in winter. This type of forest is also known as taiga, a term which is sometimes applied to the climate found therein as well. Even though the diversity may be low, the area and numbers are high, and the taiga (boreal) forest is the largest forest biome on the planet, with most of the forests located in Russia and Canada . The process by which plants become acclimated to cold temperatures is called hardening.
Agricultural potential is generally poor, due to the natural infertility of soils[4] and the prevalence of swamps and lakes left by departing ice sheets, and short growing seasons prohibit all but the hardiest of crops. Despite the short season, the long summer days at such latitudes do permit some agriculture. In some areas, ice has scoured rock surfaces bare, entirely stripping off the overburden. Elsewhere, rock basins have been formed and stream courses dammed, creating countless lakes.[2]
Neighboring regions
Should one go northward or even toward a polar sea, one finds that the warmest month has an average temperature of less than 10 °C (50 °F), and the subarctic climate grades into a tundra climate not at all suitable for trees. Southward, this climate grades into the humid continental climates with longer summers (and usually less-severe winters) allowing broadleaf trees; in a few locations close to a temperate sea (as in northern Norway and southern Alaska), this climate can grade into a short-summer version of an oceanic climate, the subpolar oceanic climate, as the sea is approached where winter temperatures average near or above freezing despite maintaining the short, cool summers. In China and Mongolia, as one moves southwestwards or towards lower elevations, temperatures increase but precipitation is so low that the subarctic climate grades into a cold semi-arid climate.
Distribution
Dfc and Dfd distribution
The Dfc climate, by far the most common subarctic type, is found in the following areas:[5][6]
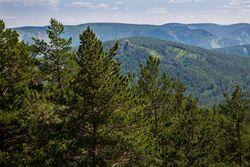
View of pines in the Kuysumy mountains in Siberia
- Northern Eurasia
- The majority of Siberia
- The Kamchatka Peninsula and the northern and central parts of the Kuril Islands and Sakhalin Island
- The northern half of Fennoscandia (milder winters in coastal areas) and higher elevations further south.
- The Western Alps between 1,600 and 2,100 meters (5,249 and 6,890 ft), and the Eastern Alps between 1,450 and 1,800 meters (4,757 and 5,906 ft)
- Central Romania
- Some parts of central Germany
- The Tatra Mountains in Poland and Slovakia, above 800 meters (2,625 ft).
- The Pyrenees, between 1,600 and 2,100 meters (5,249 and 6,890 ft)
- The Northeastern Anatolia Region and the Pontic Alps, between 1,600 and 2,100 meters (5,249 and 6,890 ft)[citation needed]
- Mountain summits in Scotland, most notably in the Cairngorms and the Nevis Range[citation needed]
- The far northeast of Turkey
Further north and east in Siberia, continentality increases so much that winters can be exceptionally severe, averaging below −38 °C (−36 °F), even though the hottest month still averages more than 10 °C (50 °F). This creates Dfd climates, which are mostly found in the Sakha Republic:
- Northeast Siberian taiga
- Central Yakutian Lowland
- Yakutsk
- Oymyakon
- Verkhoyansk
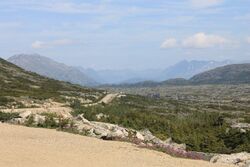
Subarctic climate in Alaska, near Yukon
- North America
- Most of Interior, Western and Southcentral Alaska
- The high Rocky Mountains in Colorado, Wyoming, Idaho, Utah, Montana and the White Mountains of New Hampshire
- Much of Canada from about 53–55°N to the tree line, including:
- Southern Labrador
- Certain areas within Newfoundland interior and along its northern coast
- Quebec: Jamésie, Côte-Nord and far southern Nunavik
- Far northern Ontario
- The northern Prairie Provinces
- The Rocky Mountain Foothills in Alberta and British Columbia
- Most of the Yukon
- Most of the Northwest Territories
- Southwestern Nunavut
In the Southern Hemisphere, this climate exists only in small, isolated pockets in the Snowy Mountains of Australia , the Southern Alps of New Zealand, the Andes Mountains of Argentina , and the Lesotho Highlands.
Dsc and Dsd distribution
Climates classified as Dsc or Dsd, with a dry summer, are rare, occurring in very small areas at high elevation around the Mediterranean Basin, Iran, Kyrgyzstan, Tajikistan, Alaska and other parts of the northwestern United States (Eastern Washington, Eastern Oregon, Southern Idaho, California's Eastern Sierra), the Russian Far East, Seneca, Oregon, and Atlin, British Columbia. Turkey and Afghanistan are exceptions; Dsc climates are common in Northeast Anatolia, in the Taurus and Köroğlu Mountains, and the Central Afghan highlands.
In the Southern Hemisphere, some of the highest mountains of the Andes in Chile and Argentina have Dsc climates.
Dwc and Dwd distribution
Climates classified as Dwc or Dwd, with a dry winter, are found in parts of East Asia, like China, where the Siberian High makes the winters colder than places like Scandinavia or Alaska interior but extremely dry (typically with around 5 millimeters (0.20 in) of rainfall equivalent per month), meaning that winter snow cover is very limited. The Dwc climate can be found in:
- Much of northern Mongolia
- Russia:
- Most of Khabarovsk Krai except the south
- Southeastern Sakha Republic
- Southern Magadan Oblast
- Northern Amur Oblast
- Northern Buryatia
- Zabaykalsky Krai
- Irkutsk Oblast
- China:
- Tahe County and Mohe County in Heilongjiang
- Northern Hulunbuir in Inner Mongolia
- Gannan in Gansu (due to extreme elevation)
- Huangnan, eastern Hainan and eastern Guoluo in Qinghai (due to extreme elevation)
- Most of Garzê and Ngawa Autonomous Prefectures (due to extreme elevation) in Sichuan
- Most of Qamdo Prefecture (due to extreme elevation) in the Tibet Autonomous Region
- Parts of Ladakh (including Siachen Glacier) and Spiti regions of India [citation needed]
- Middle reaches of the Himalayas in Nepal, Bhutan, Myanmar, and Northeast India.
- Parts of Kaema Plateau (including Mount Baekdu, Samjiyon, Musan) in North Korea[citation needed]
In the Southern Hemisphere, small pockets of the Lesotho Highlands and the Drakensberg Mountains have a Dwc classification.
Charts of selected sites
| Anchorage, Alaska, United States
|
|---|
| Climate chart (explanation) |
|---|
J |
F |
M |
A |
M |
J |
J |
A |
S |
O |
N |
D |
|
|
|
|
|
|
|
|
|
|
|
|
| Average max. and min. temperatures in °C |
| Precipitation totals in mm | | Source: NOAA |
|
| Imperial conversion |
|---|
| J | F | M | A | M | J | J | A | S | O | N | D |
|
|
|
|
|
|
|
|
|
|
|
|
| Average max. and min. temperatures in °F |
| Precipitation totals in inches |
|
| Whitehorse, Yukon, Canada
|
|---|
| Climate chart (explanation) |
|---|
J |
F |
M |
A |
M |
J |
J |
A |
S |
O |
N |
D |
|
|
|
|
|
|
|
|
|
|
|
|
| Average max. and min. temperatures in °C |
| Precipitation totals in mm | | Source: Environment Canada[7] |
|
| Imperial conversion |
|---|
| J | F | M | A | M | J | J | A | S | O | N | D |
|
|
|
|
|
|
|
|
|
|
|
|
| Average max. and min. temperatures in °F |
| Precipitation totals in inches |
|
| Yellowknife, Northwest Territories, Canada
|
|---|
| Climate chart (explanation) |
|---|
J |
F |
M |
A |
M |
J |
J |
A |
S |
O |
N |
D |
|
|
|
|
|
|
|
|
|
|
|
|
| Average max. and min. temperatures in °C |
| Precipitation totals in mm | | Source: Environment Canada[8] |
|
| Imperial conversion |
|---|
| J | F | M | A | M | J | J | A | S | O | N | D |
|
|
|
|
|
|
|
|
|
|
|
|
| Average max. and min. temperatures in °F |
| Precipitation totals in inches |
|
| Samedan, Graubünden, Switzerland
|
|---|
| Climate chart (explanation) |
|---|
J |
F |
M |
A |
M |
J |
J |
A |
S |
O |
N |
D |
|
|
|
|
|
|
|
|
|
|
|
|
| Average max. and min. temperatures in °C |
| Precipitation totals in mm | | Source: MeteoSchweiz[9] |
|
| Imperial conversion |
|---|
| J | F | M | A | M | J | J | A | S | O | N | D |
|
|
|
|
|
|
|
|
|
|
|
|
| Average max. and min. temperatures in °F |
| Precipitation totals in inches |
|
| Luleå, Sweden
|
|---|
| Climate chart (explanation) |
|---|
J |
F |
M |
A |
M |
J |
J |
A |
S |
O |
N |
D |
|
|
|
|
|
|
|
|
|
|
|
|
| Average max. and min. temperatures in °C |
| Precipitation totals in mm | | Source: World Weather Information[10] |
|
| Imperial conversion |
|---|
| J | F | M | A | M | J | J | A | S | O | N | D |
|
|
|
|
|
|
|
|
|
|
|
|
| Average max. and min. temperatures in °F |
| Precipitation totals in inches |
|
| Nerdal/Mo i Rana, Norway
|
|---|
| Climate chart (explanation) |
|---|
|
| Imperial conversion |
|---|
| J | F | M | A | M | J | J | A | S | O | N | D |
|
|
|
|
|
|
|
|
|
|
|
|
| Average max. and min. temperatures in °F |
| Precipitation totals in inches |
|
| Tromsø, Norway
|
|---|
| Climate chart (explanation) |
|---|
|
| Imperial conversion |
|---|
| J | F | M | A | M | J | J | A | S | O | N | D |
|
|
|
|
|
|
|
|
|
|
|
|
| Average max. and min. temperatures in °F |
| Precipitation totals in inches |
|
| Kiruna, Sweden
|
|---|
| Climate chart (explanation) |
|---|
J |
F |
M |
A |
M |
J |
J |
A |
S |
O |
N |
D |
|
|
|
|
|
|
|
|
|
|
|
|
| Average max. and min. temperatures in °C |
| Precipitation totals in mm | | Source: SMHI[11] |
|
| Imperial conversion |
|---|
| J | F | M | A | M | J | J | A | S | O | N | D |
|
|
|
|
|
|
|
|
|
|
|
|
| Average max. and min. temperatures in °F |
| Precipitation totals in inches |
|
| Verkhoyansk, Sakha Republic, Russia
|
|---|
| Climate chart (explanation) |
|---|
J |
F |
M |
A |
M |
J |
J |
A |
S |
O |
N |
D |
|
|
|
|
|
|
|
|
|
|
|
|
| Average max. and min. temperatures in °C |
| Precipitation totals in mm | | Source: Pogoda.ru.net |
|
| Imperial conversion |
|---|
| J | F | M | A | M | J | J | A | S | O | N | D |
|
|
|
|
|
|
|
|
|
|
|
|
| Average max. and min. temperatures in °F |
| Precipitation totals in inches |
|
| Mohe, Heilongjiang, China
|
|---|
| Climate chart (explanation) |
|---|
J |
F |
M |
A |
M |
J |
J |
A |
S |
O |
N |
D |
|
|
|
|
|
|
|
|
|
|
|
|
| Average max. and min. temperatures in °C |
| Precipitation totals in mm | | Source: Weather China[12] |
|
| Imperial conversion |
|---|
| J | F | M | A | M | J | J | A | S | O | N | D |
|
|
|
|
|
|
|
|
|
|
|
|
| Average max. and min. temperatures in °F |
| Precipitation totals in inches |
|
| Lukla, Nepal
|
|---|
| Climate chart (explanation) |
|---|
J |
F |
M |
A |
M |
J |
J |
A |
S |
O |
N |
D |
|
|
|
|
|
|
|
|
|
|
|
|
| Average max. and min. temperatures in °C |
| Precipitation totals in mm | | Source: weatherbase.com[13] |
|
| Imperial conversion |
|---|
| J | F | M | A | M | J | J | A | S | O | N | D |
|
|
|
|
|
|
|
|
|
|
|
|
| Average max. and min. temperatures in °F |
| Precipitation totals in inches |
|
| Crater Lake, Oregon, United States
|
|---|
| Climate chart (explanation) |
|---|
J |
F |
M |
A |
M |
J |
J |
A |
S |
O |
N |
D |
|
|
|
|
|
|
|
|
|
|
|
|
| Average max. and min. temperatures in °C |
| Precipitation totals in mm | | Source: SHMI[14] |
|
| Imperial conversion |
|---|
| J | F | M | A | M | J | J | A | S | O | N | D |
|
|
|
|
|
|
|
|
|
|
|
|
| Average max. and min. temperatures in °F |
| Precipitation totals in inches |
|
| Norilsk, Krasnoyarsk Krai, Russia
|
|---|
| Climate chart (explanation) |
|---|
J |
F |
M |
A |
M |
J |
J |
A |
S |
O |
N |
D |
|
|
|
|
|
|
|
|
|
|
|
|
| Average max. and min. temperatures in °C |
| Precipitation totals in mm | | Source: SHMI[15] |
|
| Imperial conversion |
|---|
| J | F | M | A | M | J | J | A | S | O | N | D |
|
|
|
|
|
|
|
|
|
|
|
|
| Average max. and min. temperatures in °F |
| Precipitation totals in inches |
|
| Östersund, Sweden
|
|---|
| Climate chart (explanation) |
|---|
J |
F |
M |
A |
M |
J |
J |
A |
S |
O |
N |
D |
|
|
|
|
|
|
|
|
|
|
|
|
| Average max. and min. temperatures in °C |
| Precipitation totals in mm | | Source: yr.no |
|
| Imperial conversion |
|---|
| J | F | M | A | M | J | J | A | S | O | N | D |
|
|
|
|
|
|
|
|
|
|
|
|
| Average max. and min. temperatures in °F |
| Precipitation totals in inches |
|
| Oulu, Finland
|
|---|
| Climate chart (explanation) |
|---|
J |
F |
M |
A |
M |
J |
J |
A |
S |
O |
N |
D |
|
|
|
|
|
|
|
|
|
|
|
|
| Average max. and min. temperatures in °C |
| Precipitation totals in mm | | Source: Tilastokeskus: Tilastoja Suomen ilmastosta 1981-2010 |
|
| Imperial conversion |
|---|
| J | F | M | A | M | J | J | A | S | O | N | D |
|
|
|
|
|
|
|
|
|
|
|
|
| Average max. and min. temperatures in °F |
| Precipitation totals in inches |
|
See also
References
- ↑ Stepanova, N.A. (1958). "On the Lowest Temperatures on Earth". Monthly Weather Review 86 (1): 6–10. doi:10.1175/1520-0493(1958)086<0006:OTLTOE>2.0.CO;2. Bibcode: 1958MWRv...86....6S. http://docs.lib.noaa.gov/rescue/mwr/086/mwr-086-01-0006.pdf. Retrieved 4 January 2018.
- ↑ 2.0 2.1 Subarctic Division
- ↑ Mount Washington Observatory: Normals, Means, and Extremes, Retrieved July 1, 2009.
- ↑ "Subarctic Division". https://www.fs.fed.us/land/ecosysmgmt/colorimagemap/images/130.html.
- ↑ Geography of climate
- ↑ Peel, M. C.; Finlayson, B. L.; McMahon, T. A. (2007). "Updated Köppen-Geiger Climate Map of the World". Hydrology and Earth System Sciences (Copernicus Publications). doi:10.5194/hess-11-1633-2007. http://people.eng.unimelb.edu.au/mpeel/koppen.html. Retrieved 23 October 2019.
- ↑ "Whitehorse A". Environment Canada. 2011-01-19. https://climate.weather.gc.ca/climate_normals/results_1981_2010_e.html?searchType=stnName&txtStationName=whitehorse&searchMethod=contains&txtCentralLatMin=0&txtCentralLatSec=0&txtCentralLongMin=0&txtCentralLongSec=0&stnID=1617&dispBack=0.
- ↑ "Canadian Climate Normals 1971–2000". Environment Canada. http://www.climate.weatheroffice.ec.gc.ca/climate_normals/results_e.html?Province=NWT%20&StationName=&SearchType=&LocateBy=Province&Proximity=25&ProximityFrom=City&StationNumber=&IDType=MSC&CityName=&Park%20Name=&LatitudeDegrees=&LatitudeMinutes=&LongitudeDegrees=&LongitudeMinutes=&NormalsClass=A&SelNormals=&StnId=1706&.
- ↑ "Normwert-Tabellen 1961–1990" (in de, fr, it). MeteoSchweiz. http://www.meteoswiss.admin.ch/web/de/klima/klima_schweiz/tabellen.html.
- ↑ "Luleå, SWE". World Weather Information. http://weather.msn.com/local.aspx?wealocations=wc:SWXX0019&q=Lule%C3%A5%2c+SWE.
- ↑ "Nederbörd, normalvärden 1961–90". SMHI. http://www.smhi.se/cmp/jsp/polopoly.jsp?d=8046&a=22371&l=sv.
- ↑ "Mohe County, 1971-2000". Weather.com.cn. http://www.weather.com.cn/cityintro/101050703.shtml.
- ↑ "Lukla, Nepal Travel Weather Averages (Weatherbase)". http://www.weatherbase.com/weather/weather.php3?s=603638.
- ↑ "Crater Lake Nat'l Park H, Oregon Period of Record Climate Summary". Western Regional Climate Center. http://www.wrcc.dri.edu/cgi-bin/cliMAIN.pl?orcrat.
- ↑ "Norilsk Weather Averages and Climate". weather2travel. http://www.weather2travel.com/climate-guides/russia-central-asia/norilsk.php.
|
|---|
| Class A | |
|---|
| Class B | |
|---|
| Class C | |
|---|
| Class D |
- Humid continental (Dfa, Dwa, Dfb, Dwb, Dsa, Dsb)
- Subarctic (Dfc, Dwc, Dfd, Dwd, Dsc, Dsd)
|
|---|
| Class E | |
|---|
 | Original source: https://en.wikipedia.org/wiki/Subarctic climate. Read more |
.svg)
_4Y1A8757_(28363120875).jpg)


