Biology:Complete linkage
In genetics, complete (or absolute) linkage[1] is defined as the state in which two loci are so close together that alleles of these loci are virtually never separated by crossing over. The closer the physical location of two genes on the DNA, the less likely they are to be separated by a crossing-over event. In the case of male Drosophila there is complete absence of recombinant types due to absence of crossing over. This means that all of the genes that start out on a single chromosome, will end up on that same chromosome in their original configuration. In the absence of recombination, only parental phenotypes are expected.[2]
Linkage
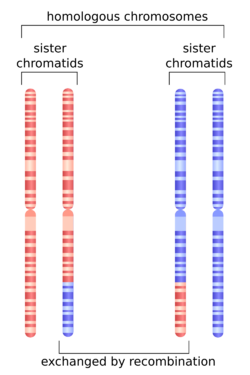
Genetic Linkage is the tendency of alleles, which are located closely together on a chromosome, to be inherited together during the process of meiosis in sexually reproducing organisms. During the process of meiosis, homologous chromosomes pair up, and can exchange corresponding sections of DNA. As a result, genes that were originally on the same chromosome can finish up on different chromosomes. This process is known as genetic recombination. The rate of recombination of two discrete loci corresponds to their physical proximity. Alleles that are closer together have lower rates of recombination than those that are located far apart. The distance between two alleles on a chromosome can be determined by calculating the percentage or recombination between two loci. These probabilities of recombination can be used to construct a linkage map, or a graphical representation of the location of genes and gene in respect to one another. If linkage is complete, there should be no recombination events that separate the two alleles, and therefore only parental combinations of alleles should be observed in offspring. Linkage between two loci can have significant implications regarding the inheritance of certain types of diseases.[3]
Gene maps or Qualitative Trait Loci (QTL) maps can be produced using two separate methods. One way uses the frequency of marker alleles and compares them to individuals selected from the two tails of the trait distribution. This is called the Trait-Based approach and strictly uses phenotypic information only to select the individuals for a sample. The other approach is called the Marker-Base approach (MB), and uses both the difference in marker allele frequencies and the phenotypic values of each marker genotype when selecting samples.[4]
(Click here for more information on Linkage Maps [1])
Recombination During Meiosis
In diploid eukaryotic cells, recombination can occur during the process of Meiosis. Homologous chromosomes pair up during meiosis before finally splitting, resulting in two haploid daughter cells each with a single copy of every chromosome. While homologous chromosomes are lined up, they are free to exchange corresponding segments of their own DNA with that of their homolog. This results in a chromosomes that carry both maternal and paternal DNA. Through recombination, daughter cells have the greatest amount of genetic diversity.[5]
(Click Here for a video tutorial explaining genetic recombination)
Methods of Analysis
Hierarchical Clustering
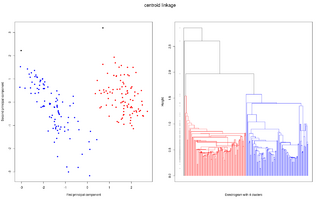
One powerful tool for interpreting and graphing linkage data sets is called Hierarchical Clustering. Clustering organizes things into groups based on similarity. In the case of linkage, similarity equates to physical proximity on a chromosome. Hierarchical clustering is a bottom-up approach to cluster analysis, in which the two closest data points are grouped together and are treated as a single data point for later clustering. In complete-linkage Hierarchical Clustering, this process of combining data points into clusters of increasing size is repeated until all date as part of a single cluster.[6] The resulting diagram from a Hierarchical Cluster Analysis is called a dendrogram, in which data are nested into brackets of increasing dissimilarity. Two common issues with Hierarchical Clustering include designating a specific distance of “similarity” between two data points, in order to generate meaningful associations between data points, and also how to merge data points, in a way that will be helpful for further clustering once they have been deemed similar. A cross-clustering algorithm with automatic estimation of the number of clusters has been designed, which helps resolve some of these issues. By fine tuning the number of clusters expected, the possibility of associating two unrelated clusters is minimized.[7] Again, under this type of analysis, a single resultant cluster signifies complete-linkage, since all data points are within the range of assigned similarity.
(Click Here for an interactive Hierarchical Clustering Demo)
History
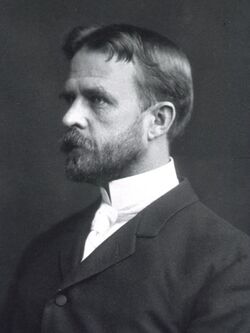
The idea of genetic linkage was first discovered by the British geneticists William Bateson, Edith Rebecca Saunders and Reginald Punnett. Thomas Hunt Morgan expanded the idea of linkage after noticing that in some instances the observed rate of crossing-over events differed from the expected rate of crossing-over events. He attributed the depressed rates of recombination to the smaller spatial separation of genes on a chromosome; Hypothesizing that genes which are more closely positioned on a chromosome will have smaller rates of recombination than those that are spaced farther apart.[8] The unit of measurement describing the distance between two linked genes is the Centimorgan, and is named after Thomas Hunt Morgan. A centimorgan is equivalent to the percent of recombination. two loci with 2% recombination frequency are located 2 centimorgans apart.[9]
[math]\displaystyle{ \text{recombination frequency}= \frac{\text{Number Recombinant Progeny}}{\text{Total Number Progeny}}\times100\% }[/math][10]
Uses In Research
Economic Benefits
Being able to determine linkage between genes can also have major economic benefits. Learning about linkage of traits in sugar cane has led to more productive and lucrative growth of the crop. Sugar cane is a sustainable crop that is one of the most economically viable renewable energy sources. QTL analysis for sugarcane was used to construct a linkage map that identified gene clusters and important linked loci that can be used to predict the response to fungal infection in a specific line of sugar cane.[11]
Medical Benefits
Linkage mapping can also be useful in determining the inheritance patterns of traits such as psychological disease. Linkage studies of panic disorder and anxiety disorders have indicated regions of interest on specific chromosomes. Chromosomes 4q21 and 7p are being considered strong candidate regions for panic and fear-associated anxiety disorder loci. Knowing the specific location of these loci and their probability of being inherited together based on their linkage can offer insight into how these disorders are passed down, and why they often occur together in patients.[12]
References
- ↑ "7.3: Linkage Reduces Recombination Frequency" (in en). 2016-06-03. https://bio.libretexts.org/Bookshelves/Genetics/Book%3A_Online_Open_Genetics_(Nickle_and_Barrette-Ng)/07%3A_Linkage_and_Mapping/7.03%3A__Linkage_Reduces_Recombination_Frequency.
- ↑ "Genetic Recombination and Gene Mapping | Learn Science at Scitable". http://www.nature.com/scitable/topicpage/Thomas-Hunt-Morgan-Genetic-Recombination-and-Gene-496.
- ↑ Single, Richard M.; Strayer, Nick; Thomson, Glenys; Paunic, Vanja; Albrecht, Mark; Maiers, Martin (2015-09-07). "Asymmetric linkage disequilibrium: Tools for assessing multiallelic LD". Human Immunology 77 (3): 288–94. doi:10.1016/j.humimm.2015.09.001. ISSN 1879-1166. PMID 26359129.
- ↑ Tenesa, Albert; Visscher, Peter M.; Carothers, Andrew D.; Knott, Sara A. (2005-03-01). "Mapping quantitative trait loci using linkage disequilibrium: marker- versus trait-based methods". Behavior Genetics 35 (2): 219–228. doi:10.1007/s10519-004-0811-5. ISSN 0001-8244. PMID 15685434.
- ↑ "Genetic Recombination | Learn Science at Scitable". http://www.nature.com/scitable/topicpage/Genetic-Recombination-514.
- ↑ Sharma, Alok; Boroevich, Keith; Shigemizu, Daichi; Kamatani, Yoichiro; Kubo, Michiaki; Tsunoda, Tatsuhiko (2016-03-24). "Hierarchical Maximum Likelihood Clustering Approach". IEEE Transactions on Bio-Medical Engineering 64 (1): 112–122. doi:10.1109/TBME.2016.2542212. ISSN 1558-2531. PMID 27046867. https://zenodo.org/record/896096.
- ↑ Tellaroli, Paola; Bazzi, Marco; Donato, Michele; Brazzale, Alessandra R.; Drăghici, Sorin (2016-01-01). "Cross-Clustering: A Partial Clustering Algorithm with Automatic Estimation of the Number of Clusters". PLOS ONE 11 (3): e0152333. doi:10.1371/journal.pone.0152333. ISSN 1932-6203. PMID 27015427. Bibcode: 2016PLoSO..1152333T.
- ↑ "The First Genetic-Linkage Map | Caltech". 21 March 2013. http://www.caltech.edu/news/first-genetic-linkage-map-38798.
- ↑ Stahl, F. W. (2001-01-01). Centimorgan (cM) A2 - Hughes, Stanley MaloyKelly. San Diego: Academic Press. pp. 495. ISBN 9780080961569.
- ↑ "Genetic Recombination and Gene Mapping | Learn Science at Scitable". http://www.nature.com/scitable/topicpage/Thomas-Hunt-Morgan-Genetic-Recombination-and-Gene-496.
- ↑ Palhares, Alessandra C.; Rodrigues-Morais, Taislene B.; Van Sluys, Marie-Anne; Domingues, Douglas S.; Maccheroni, Walter; Jordão, Hamilton; Souza, Anete P.; Marconi, Thiago G. et al. (2012-01-01). "A novel linkage map of sugarcane with evidence for clustering of retrotransposon-based markers". BMC Genetics 13: 51. doi:10.1186/1471-2156-13-51. ISSN 1471-2156. PMID 22742069.
- ↑ Logue, Mark W.; Bauver, Sarah R.; Knowles, James A.; Gameroff, Marc J.; Weissman, Myrna M.; Crowe, Raymond R.; Fyer, Abby J.; Hamilton, Steven P. (2012-04-01). "Multivariate analysis of anxiety disorders yields further evidence of linkage to chromosomes 4q21 and 7p in panic disorder families". American Journal of Medical Genetics Part B 159B (3): 274–280. doi:10.1002/ajmg.b.32024. ISSN 1552-485X. PMID 22253211.
 |


