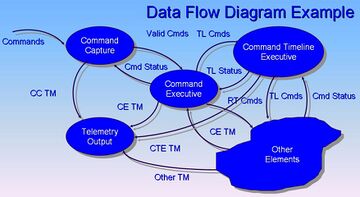
Data flow diagram

A data flow diagram (DFD) is a graphical representation of the "flow" of data through an information system, modelling its process aspects. A DFD is often used as a preliminary step to create an overview of the system without going into great detail, which can later be elaborated.[2] DFDs can also be used for the visualization of data processing (structured design).[citation needed]
A DFD shows what kind of information will be input to and output from the system, how the data will advance through the system, and where the data will be stored. It does not show information about process timing or whether processes will operate in sequence or in parallel, unlike a traditional structured flowchart which focuses on control flow, or a UML activity workflow diagram, which presents both control and data flows as a unified model.[citation needed]
History
In the 1970s, Larry Constantine, the original developer of structured design, proposed data flow diagrams as a practical technique based on Martin and Estrin's "Data Flow Graph" model of computation.[3]
Data flow diagrams (DFD) quickly became a popular way to visualize the major steps and data involved in software system processes. DFDs were usually used to show data flow in a computer system, although they could in theory be applied to business process modeling. DFDs were useful to document the major data flows or to explore a new high-level design in terms of data flow.[4]
Theory

Data flow diagrams are also known as bubble charts.[5] DFD is a designing tool used in the top-down approach to Systems Design. This context-level DFD is next "exploded", to produce a Level 1 DFD that shows some of the detail of the system being modeled. The Level 1 DFD shows how the system is divided into sub-systems (processes), each of which deals with one or more of the data flows to or from an external agent, and which together provide all of the functionality of the system as a whole. It also identifies internal data stores that must be present in order for the system to do its job, and shows the flow of data between the various parts of the system.[citation needed]
Data flow diagrams are one of the three essential perspectives of the structured-systems analysis and design method SSADM. The sponsor of a project and the end users will need to be briefed and consulted throughout all stages of a system's evolution. With a data flow diagram, users are able to visualize how the system will operate, what the system will accomplish, and how the system will be implemented. The old system's data flow diagrams can be drawn up and compared with the new system's data flow diagrams to draw comparisons to implement a more efficient system. Data flow diagrams can be used to provide the end user with a physical idea of where the data they input ultimately has an effect upon the structure of the whole system from order to dispatch to report. How any system is developed can be determined through a data flow diagram model.[citation needed]
In the course of developing a set of levelled data flow diagrams the analyst/designer is forced to address how the system may be decomposed into component sub-systems, and to identify the transaction data in the data model.[citation needed]
Data flow diagrams can be used in both the Analysis and Design phases of the SDLC.[citation needed]
There are different notations to draw data flow diagrams (Yourdon & Coad and Gane & Sarson[6]), defining different visual representations for processes, data stores, data flow, and external entities.[7]
Physical vs. logical DFD
A logical DFD captures the data flows that are necessary for a system to operate. It describes the processes that are undertaken, the data required and produced by each process, and the stores needed to hold the data. On the other hand, a physical DFD shows how the system is actually implemented, either at the moment (Current Physical DFD), or how the designer intends it to be in the future (Required Physical DFD). Thus, a Physical DFD may be used to describe the set of data items that appear on each piece of paper that move around an office, and the fact that a particular set of pieces of paper are stored together in a filing cabinet. It is quite possible that a Physical DFD will include references to data that are duplicated, or redundant, and that the data stores, if implemented as a set of database tables, would constitute an un-normalised (or de-normalised) relational database. In contrast, a Logical DFD attempts to capture the data flow aspects of a system in a form that has neither redundancy nor duplication.[citation needed]
See also
- Activity diagram
- Business Process Model and Notation
- Control flow diagram
- Data island
- Dataflow
- Directed acyclic graph
- Drakon-chart
- Functional flow block diagram
- Function model
- IDEF0
- Pipeline
- Structured Analysis and Design Technique
- Structure chart
- System context diagram
- Value stream mapping
- Workflow
References
- ↑ John Azzolini (2000). Introduction to Systems Engineering Practices. July 2001.
- ↑ Bruza, P. D., Van der Weide,[citation needed]Th. P., "The Semantics of Data Flow Diagrams", University of Nijmegen, 1993.
- ↑ W. Stevens, G. Myers, L. Constantine, "Structured Design", IBM Systems Journal, 13 (2), 115-139, 1974.
- ↑ Craig Larman, "Applying UML and Patterns", Pearson Education, ISBN:978-81-7758-979-5
- ↑ Introduced by Clive Finkelstein in Australia, CACI in the UK, and later writers such as James Martin
- ↑ Chris Gane and Trish Sarson. Structured Systems Analysis: Tools and Techniques. McDonnell Douglas Systems Integration Company, 1977
- ↑ How to draw Data Flow Diagrams
Bibliography
External links


