Earth:Planetary boundary layer
File:The air over Los Angeles.ogv

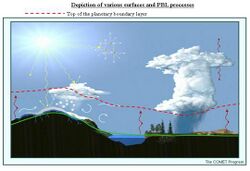
In meteorology, the planetary boundary layer (PBL), also known as the atmospheric boundary layer (ABL) or peplosphere, is the lowest part of the atmosphere and its behaviour is directly influenced by its contact with a planetary surface.[1] On Earth it usually responds to changes in surface radiative forcing in an hour or less. In this layer physical quantities such as flow velocity, temperature, and moisture display rapid fluctuations (turbulence) and vertical mixing is strong. Above the PBL is the "free atmosphere",[2] where the wind is approximately geostrophic (parallel to the isobars),[3] while within the PBL the wind is affected by surface drag and turns across the isobars (see Ekman layer for more detail).
Cause of surface wind gradient

Typically, due to aerodynamic drag, there is a wind gradient in the wind flow ~100 meters above the Earth's surface—the surface layer of the planetary boundary layer. Wind speed increases with increasing height above the ground, starting from zero[4] due to the no-slip condition.[5] Flow near the surface encounters obstacles that reduce the wind speed, and introduce random vertical and horizontal velocity components at right angles to the main direction of flow.[6] This turbulence causes vertical mixing between the air moving horizontally at one level and the air at those levels immediately above and below it, which is important in dispersion of pollutants[7] and in soil erosion.[8]
The reduction in velocity near the surface is a function of surface roughness, so wind velocity profiles are quite different for different terrain types.[5] Rough, irregular ground, and man-made obstructions on the ground can reduce the geostrophic wind speed by 40% to 50%.[9][10] Over open water or ice, the reduction may be only 20% to 30%.[11][12] These effects are taken into account when siting wind turbines.[13][14]
For engineering purposes, the wind gradient is modeled as a simple shear exhibiting a vertical velocity profile varying according to a power law with a constant exponential coefficient based on surface type. The height above ground where surface friction has a negligible effect on wind speed is called the "gradient height" and the wind speed above this height is assumed to be a constant called the "gradient wind speed".[10][15][16] For example, typical values for the predicted gradient height are 457 m for large cities, 366 m for suburbs, 274 m for open terrain, and 213 m for open sea.[17]
Although the power law exponent approximation is convenient, it has no theoretical basis.[18] When the temperature profile is adiabatic, the wind speed should vary logarithmically with height.[19] Measurements over open terrain in 1961 showed good agreement with the logarithmic fit up to 100 m or so (within the surface layer), with near constant average wind speed up through 1000 m.[20]
The shearing of the wind is usually three-dimensional,[21] that is, there is also a change in direction between the 'free' pressure gradient-driven geostrophic wind and the wind close to the ground.[22] This is related to the Ekman spiral effect. The cross-isobar angle of the diverted ageostrophic flow near the surface ranges from 10° over open water, to 30° over rough hilly terrain, and can increase to 40°-50° over land at night when the wind speed is very low.[12]
After sundown the wind gradient near the surface increases, with the increasing stability.[23] Atmospheric stability occurring at night with radiative cooling tends to vertically constrain turbulent eddies, thus increasing the wind gradient.[8] The magnitude of the wind gradient is largely influenced by the weather, principally atmospheric stability and the height of any convective boundary layer or capping inversion. This effect is even larger over the sea, where there is much less diurnal variation of the height of the boundary layer than over land.[24] In the convective boundary layer, strong mixing diminishes vertical wind gradient.[25]
Nocturnal and diurnal conditions
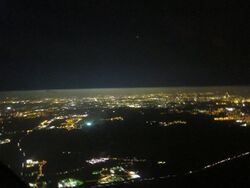
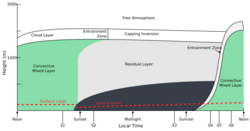
The planetary boundary layer is different between day and night. During the day inversion layers formed during the night are broken up as a consequence of the turbulent rise of heated air.[26] The boundary layer stabilises "shortly before sunset" and remains so during the night.[26] All this make up a daily cycle.[26] During winter and cloudy days the breakup of the nighttime layering is incomplete and atmospheric conditions established in previous days can persist.[26][27] The breakup of the nighttime boundary layer structure is fast on sunny days.[27] The driving force is convective cells with narrow updraft areas and large areas of gentle downdraft.[27] These cells exceed 200–500 m in diameter.[27]
Constituent layers

As Navier–Stokes equations suggest, the planetary boundary layer turbulence is produced in the layer with the largest velocity gradients that is at the very surface proximity. This layer – conventionally called a surface layer – constitutes about 10% of the total PBL depth. Above the surface layer the PBL turbulence gradually dissipates, losing its kinetic energy to friction as well as converting the kinetic to potential energy in a density stratified flow. The balance between the rate of the turbulent kinetic energy production and its dissipation determines the planetary boundary layer depth. The PBL depth varies broadly. At a given wind speed, e.g. 8 m/s, and so at a given rate of the turbulence production, a PBL in wintertime Arctic could be as shallow as 50 m, a nocturnal PBL in mid-latitudes could be typically 300 m in thickness, and a tropical PBL in the trade-wind zone could grow to its full theoretical depth of 2000 m. The PBL depth can be 4000 m or higher in late afternoon over desert.
In addition to the surface layer, the planetary boundary layer also comprises the PBL core (between 0.1 and 0.7 of the PBL depth) and the PBL top or entrainment layer or capping inversion layer (between 0.7 and 1 of the PBL depth). Four main external factors determine the PBL depth and its mean vertical structure:
- the free atmosphere wind speed;
- the surface heat (more exactly buoyancy) balance;
- the free atmosphere density stratification;
- the free atmosphere vertical wind shear or baroclinicity.
Principal types

Convective planetary boundary layer (CBL)
A convective planetary boundary layer is a type of planetary boundary layer where positive buoyancy flux at the surface creates a thermal instability and thus generates additional or even major turbulence. (This is also known as having CAPE or convective available potential energy; see atmospheric convection.) A convective boundary layer is typical in tropical and mid-latitudes during daytime. Solar heating assisted by the heat released from the water vapor condensation could create such strong convective turbulence that the free convective layer comprises the entire troposphere up to the tropopause (the boundary in the Earth's atmosphere between the troposphere and the stratosphere), which is at 10 km to 18 km in the Intertropical convergence zone).
Stably stratified planetary boundary layer (SBL)

The SBL is a PBL when negative buoyancy flux at the surface damps the turbulence; see Convective inhibition. An SBL is solely driven by the wind shear turbulence and hence the SBL cannot exist without the free atmosphere wind. An SBL is typical in nighttime at all locations and even in daytime in places where the Earth's surface is colder than the air above. An SBL plays a particularly important role in high latitudes where it is often prolonged (days to months), resulting in very cold air temperatures.
Physical laws and equations of motion, which govern the planetary boundary layer dynamics and microphysics, are strongly non-linear and considerably influenced by properties of the Earth's surface and evolution of processes in the free atmosphere. To deal with this complexity, the whole array of turbulence modelling has been proposed. However, they are often not accurate enough to meet practical requirements. Significant improvements are expected from application of a large eddy simulation technique to problems related to the PBL.
Perhaps the most important processes,[clarification needed] which are critically dependent on the correct representation of the PBL in the atmospheric models (Atmospheric Model Intercomparison Project), are turbulent transport of moisture (evapotranspiration) and pollutants (air pollutants). Clouds in the boundary layer influence trade winds, the hydrological cycle, and energy exchange.
See also
- Aeroplankton
- Boundary layer
- Ekman layer
- Mixed layer
- Alpine planetary boundary layer
- Turbulence
- Wind shear
- Microburst
- Atmospheric physics
- Atmospheric sciences
- Atmospheric electricity
- Astronomical seeing
- Remote sensing atmospheric boundary layer
- Representations of the atmospheric boundary layer in global climate models
- Atmospheric dispersion modeling
References
- ↑ "Planetary boundary layer | atmospheric science | Britannica". https://www.britannica.com/science/planetary-boundary-layer.
- ↑ "Free atmosphere". http://glossary.ametsoc.org/wiki/Free_atmosphere.
- ↑ "Geostrophic wind level". http://glossary.ametsoc.org/wiki/Geostrophic_wind_level.
- ↑ Wizelius, Tore (2007). Developing Wind Power Projects. London: Earthscan Publications Ltd.. p. 40. ISBN 978-1-84407-262-0. https://archive.org/details/developingwindpo0000wize. "The relation between wind speed and height is called the wind profile or wind gradient."
- ↑ 5.0 5.1 Brown, G. (2001). Sun, Wind & Light. New York: Wiley. p. 18. ISBN 0-471-34877-5.
- ↑ Dalgliesh, W. A.; D. W. Boyd (1962-04-01). "CBD-28. Wind on Buildings". Canadian Building Digest. http://irc.nrc-cnrc.gc.ca/pubs/cbd/cbd028_e.html. Retrieved 2007-06-30. "Flow near the surface encounters small obstacles that change the wind speed and introduce random vertical and horizontal velocity components at right angles to the main direction of flow.".
- ↑ Hadlock, Charles (1998). Mathematical Modeling in the Environment. Washington: Mathematical Association of America. ISBN 0-88385-709-X. https://archive.org/details/supplementarymat0000hadl.
- ↑ 8.0 8.1 Lal, R. (2005). Encyclopedia of Soil Science. New York: Marcel Dekker. p. 618. ISBN 0-8493-5053-0.
- ↑ Oke, T. (1987). Boundary Layer Climates. London: Methuen. p. 54. ISBN 0-415-04319-0. "Therefore the vertical gradient of mean wind speed (dū/dz) is greatest over smooth terrain, and least over rough surfaces."
- ↑ 10.0 10.1 Crawley, Stanley (1993). Steel Buildings. New York: Wiley. p. 272. ISBN 0-471-84298-2.
- ↑ Harrison, Roy (1999). Understanding Our Environment. Cambridge: Royal Society of Chemistry. p. 11. ISBN 0-85404-584-8. https://archive.org/details/understandingour00harr_090.
- ↑ 12.0 12.1 Thompson, Russell (1998). Atmospheric Processes and Systems. New York: Routledge. pp. 102–103. ISBN 0-415-17145-8. https://archive.org/details/atmosphericproce00thom.
- ↑ Maeda, Takao, Shuichiro Homma, and Yoshiki Ito. Effect of Complex Terrain on Vertical Wind Profile Measured by SODAR Technique. Retrieved on 2008-07-04.
- ↑ Lubosny, Zbigniew (2003). Wind Turbine Operation in Electric Power Systems: Advanced Modeling. Berlin: Springer. p. 17. ISBN 3-540-40340-X.
- ↑ Gupta, Ajaya (1993). Guidelines for Design of Low-Rise Buildings Subjected to Lateral Forces. Boca Raton: CRC Press. p. 49. ISBN 0-8493-8969-0.
- ↑ Stoltman, Joseph (2005). International Perspectives on Natural Disasters: Occurrence, Mitigation, and Consequences. Berlin: Springer. p. 73. ISBN 1-4020-2850-4.
- ↑ Chen, Wai-Fah (1997). Handbook of Structural Engineering. Boca Raton: CRC Press. pp. 12–50. ISBN 0-8493-2674-5. https://archive.org/details/handbookstructur00chen.
- ↑ Ghosal, M. (2005). "7.8.5 Vertical Wind Speed Gradient". Renewable Energy Resources. City: Alpha Science International, Ltd.. pp. 378–379. ISBN 978-1-84265-125-4.
- ↑ Stull, Roland (1997). An Introduction to Boundary Layer Meteorology. Boston: Kluwer Academic Publishers. p. 442. ISBN 90-277-2768-6. "...both the wind gradient and the mean wind profile itself can usually be described diagnostically by the log wind profile."
- ↑ Thuillier, R.H.; Lappe, U.O. (1964). "Wind and Temperature Profile Characteristics from Observations on a 1400 ft Tower". Journal of Applied Meteorology (American Meteorological Society) 3 (3): 299–306. doi:10.1175/1520-0450(1964)003<0299:WATPCF>2.0.CO;2. ISSN 1520-0450. Bibcode: 1964JApMe...3..299T.
- ↑ Mcilveen, J. (1992). Fundamentals of Weather and Climate. London: Chapman & Hall. p. 184. ISBN 0-412-41160-1. https://archive.org/details/fundamentalsofwe0000mcil/page/184.
- ↑ Burton, Tony (2001). Wind Energy Handbook. London: J. Wiley. p. 20. ISBN 0-471-48997-2. https://archive.org/details/handbookwindener00burt.
- ↑ Köpp, F.; Schwiesow, R.L.; Werner, C. (January 1984). "Remote Measurements of Boundary-Layer Wind Profiles Using a CW Doppler Lidar". Journal of Applied Meteorology and Climatology (American Meteorological Society) 23 (1): 153. doi:10.1175/1520-0450(1984)023<0148:RMOBLW>2.0.CO;2. ISSN 1520-0450. Bibcode: 1984JApMe..23..148K.
- ↑ Johansson, C.; Uppsala, S.; Smedman, A.S. (2002). "Does the height of the boundary layer influence the turbulence structure near the surface over the Baltic Sea?". 15th Conference on Boundary Layer and Turbulence. American Meteorological Society. http://ams.confex.com/ams/BLT/techprogram/paper_43332.htm.
- ↑ Shao, Yaping (2000). Physics and Modelling of Wind Erosion. City: Kluwer Academic. p. 69. ISBN 978-0-7923-6657-7. "In the bulk of the convective boundary layer, strong mixing diminishes vertical wind gradient..."
- ↑ 26.0 26.1 26.2 26.3 Foken 2017, p. 7.
- ↑ 27.0 27.1 27.2 27.3 Foken 2017, p. 8.
- Foken, Thomas (2017). Micrometeorology. Berlin, Germany: Springer. ISBN 978-3-642-25439-0.
External links
- Description of the planetary boundary layer at theweatherprediction.com
- American Meteorological Society glossary entry
fr:Couche limite#Météorologie
 |
