Earth:Tornado intensity

Tornado intensity is the measure of wind speeds and potential risk produced by a tornado. Intensity can be measured by in situ or remote sensing measurements, but since these are impractical for wide-scale use, intensity is usually inferred by proxies, such as damage. The Fujita scale, Enhanced Fujita scale, and the International Fujita scale rate tornadoes by the damage caused.[1][2] In contrast to other major storms such as hurricanes and typhoons, such classifications are only assigned retroactively. Wind speed alone is not enough to determine the intensity of a tornado.[3] An EF0 tornado may damage trees and peel some shingles off roofs, while an EF5 tornado can rip well-anchored homes off their foundations, leaving them bare— even deforming large skyscrapers. The similar TORRO scale ranges from a T0 for extremely weak tornadoes to T11 for the most powerful known tornadoes. Doppler radar data, photogrammetry, and ground swirl patterns (cycloidal marks) may also be analyzed to determine the intensity and assign a rating.
Tornadoes vary in intensity regardless of shape, size, and location, though strong tornadoes are typically larger than weak tornadoes. The association with track length and duration also varies, although longer-track (and longer-lived) tornadoes tend to be stronger.[4] In the case of violent tornadoes, only a small portion of the path area is of violent intensity; most of the higher intensity is from subvortices.[5] In the United States, 80% of tornadoes are rated EF0 or EF1 (equivalent to T0 through T3). The rate of occurrence drops off quickly with increasing strength; less than 1% are rated as violent (EF4 or EF5, equivalent to T8 through T11).[6]
History of tornado intensity measurements

For many years, before the advent of Doppler radar, scientists relied on educated guesses for tornado wind speed. The only evidence indicating wind speeds found in the tornado was the damage left behind by tornadoes that struck populated areas. Some believed they reach 400 miles per hour (640 kilometers per hour); others thought they might exceed 500 miles per hour (800 km/h), and perhaps even be supersonic. One can still find these incorrect guesses in some old (until the 1960s) literature, such as the original Fujita intensity scale developed by Dr. Tetsuya Theodore "Ted" Fujita in the early 1970s. However, one can find accounts (e.g. [1]; be sure to scroll down) of some remarkable work done in this field by a U.S. Army soldier, Sergeant John Park Finley.
In 1971, Dr. Fujita introduced the idea of a scale to measure tornado winds. With the help of colleague Allen Pearson, he created and introduced what came to be called the Fujita scale in 1973. The F in F1, F2, etc. stands for Fujita. The scale was based on a relationship between the Beaufort scale and the Mach number scale; the low end of F1 on his scale corresponds to the low end of B12 on the Beaufort scale, and the low end of F12 corresponds to the speed of sound at sea level, or Mach 1. In practice, tornadoes are only assigned categories F0 through F5.
The TORRO scale, created by the Tornado and Storm Research Organization (TORRO), was developed in 1974 and published a year later. The TORRO scale has 12 levels, which cover a broader range with tighter graduations. It ranges from a T0 for extremely weak tornadoes to T11 for the most powerful known tornadoes. T0–T1 roughly corresponds to F0, T2–T3 to F1, and so on. While T10–T11 would be roughly equivalent to F5, the highest tornado rated to date on the TORRO scale was a T8.[7][8] Some debate exists as to the usefulness of the TORRO scale over the Fujita scale—while it may be helpful for statistical purposes to have more levels of tornado strength, often the damage caused could be created by a large range of winds, rendering it hard to narrow the tornado down to a single TORRO scale category.

Research conducted in the late 1980s and 1990s suggested that even with the implication of the Fujita scale, tornado winds were notoriously overestimated, especially in significant and violent tornadoes. Because of this, in 2006, the American Meteorological Society introduced the Enhanced Fujita scale, to help assign realistic wind speeds to tornado damage. The scientists specifically designed the scale so that a tornado assessed on the Fujita scale and the Enhanced Fujita scale would receive the same ranking. The EF-scale is more specific in detailing the degrees of damage on different types of structures for a given wind speed. While the F-scale goes from F0 to F12 in theory, the EF-scale is capped at EF5, which is defined as "winds ≥200 miles per hour (320 km/h)".[9] In the United States, the Enhanced Fujita scale went into effect on February 2, 2007, for tornado damage assessments and the Fujita scale is no longer used.
The first observation confirming that F5 winds could occur happened on April 26, 1991. A tornado near Red Rock, Oklahoma, was monitored by scientists using a portable Doppler weather radar, an experimental radar device that measures wind speed. Near the tornado's peak intensity, they recorded a wind speed of 115–120 meters per second (260–270 miles per hour; 410–430 kilometers per hour). Though the portable radar had the uncertainty of ±5–10 metres per second (11–22 mph; 18–36 km/h), this reading was probably within the F5 range, confirming that tornadoes were capable of violent winds found nowhere else on earth.
Eight years later, during the 1999 Oklahoma tornado outbreak of May 3, another scientific team was monitoring an exceptionally violent tornado (one which eventually killed 36 people in the Oklahoma City metropolitan area). Around 7 p.m., they recorded one measurement of 301 ± 20 miles per hour (484 ± 32 km/h),[10] 50 miles per hour (80 km/h) faster than the previous record. Though this reading is just short of the theoretical F6 rating, the measurement was taken more than 100 feet (30 meters) in the air, where winds are typically stronger than at the surface. In rating tornadoes, only surface wind speeds or the wind speeds indicated by the damage resulting from the tornado, are taken into account. Also, in practice, the F6 rating is not used.
While scientists have long theorized that extremely low pressures might occur in the center of tornadoes, no measurements confirm it. A few home barometers had survived close passes by tornadoes, recording values as low as 24 inches of mercury (810 hectopascals), but these measurements were highly uncertain.[11] In 2003, a U.S. research team succeeded in dropping devices called "turtles" into an F4 tornado, and one measured a pressure drop of more than 100 hectopascals (3.0 inHg) as the tornado passed directly overhead.[12] Still, tornadoes are widely varied, so meteorologists are still researching to determine if these values are typical or not.
In 2018, the International Fujita scale was created by the European Severe Storms Laboratory as well as other various European meteorological agencies. Unlike the other three scales (Fujita, Enhanced Fujita, and TORRO), the International Fujita scale has overlapping wind speeds within the ratings. The highest tornado rated on the IF scale was the 2021 South Moravia tornado, which was rated an IF4.[13]
Typical intensity
In the U.S., F0 and F1 (T0 through T3) tornadoes account for 80% of all tornadoes. The rate of occurrence drops off quickly with increasing strength—violent tornadoes (F4/T8 or stronger), account for less than one percent of all tornado reports.[6] Worldwide, strong tornadoes account for an even smaller percentage of total tornadoes. Violent tornadoes are extremely rare outside of the United States and Canada.
F5 and EF5 tornadoes are rare. In the United States, they typically only occur once every few years,[14] and account for approximately 0.1 percent of confirmed tornadoes.[15] An F5 tornado was reported in Elie, Manitoba in Canada on June 22, 2007.[16] Before that, the last confirmed F5 was the 1999 Bridge Creek–Moore tornado, which killed 36 people on May 3, 1999.[17] Ten EF5 tornadoes have occurred in the United States, in Greensburg, Kansas on May 4, 2007, Parkersburg, Iowa on May 25, 2008, Philadelphia, Mississippi, Hackleburg, Alabama, Smithville, Mississippi, and Rainsville, Alabama (four separate tornadoes) on April 27, 2011, Joplin, Missouri on May 22, 2011, El Reno, Oklahoma on May 24, 2011, Moore, Oklahoma on May 20, 2013,[14] and Enderlin, North Dakota on June 20, 2025.[18]
Typical damage
| T0 | T1 | T2 | T3 | T4 | T5 | T6 | T7 | T8 | T9 | T10 | T11 | ||||||||||||
| IF0− | IF0 | IF0+ | IF1− | IF1 | IF1+ | IF2− | IF2 | IF2+ | IF3 | IF4 | IF5 | ||||||||||||
| F0 EF0 |
F1 EF1 |
F2 EF2 |
F3 EF3 |
F4 EF4 |
F5 EF5 | ||||||||||||||||||
| Weak | Strong | Violent | |||||||||||||||||||||
| Significant | |||||||||||||||||||||||
| Intense | |||||||||||||||||||||||
A typical tornado has winds of 110 miles per hour (180 km/h) or less, is about 250 feet (76 m) across, and travels about one mile (1.6 km) before dissipating. However, tornado behavior is variable; these figures represent statistical probabilities only.
Two tornadoes that look almost the same can produce drastically different effects. Also, two tornadoes that look very different can produce similar damage, because tornadoes form by several different mechanisms and also follow a lifecycle that causes the same tornado to change in appearance over time. People in the path of a tornado should never attempt to determine its strength as it approaches. Between 1950 and 2014 in the United States, 222 people have been killed by (E)F1 tornadoes, and 21 have been killed by (E)F0 tornadoes.[21][22]
Weak tornadoes
Around 60–70 percent [23] of tornadoes are designated EF1 or EF0, also known as "weak" tornadoes. But "weak" is a relative term for tornadoes, as even these can cause significant damage. F0 and F1 tornadoes are typically short-lived; since 1980, almost 75 percent of tornadoes rated weak stayed on the ground for 1 mile (1.6 km) or less.[17] In this time, though, they can cause both damage and fatalities.
EF0 (T0–T1) damage is characterized by superficial damage to structures and vegetation. Well-built structures are typically unscathed, though sometimes sustaining broken windows, with minor damage to roofs and chimneys. Billboards and large signs can be knocked down. Trees may have large branches broken off and can be uprooted if they have shallow roots. Any tornado that is confirmed, but causes no damage (i.e., remains in open fields) is normally rated EF0, as well, even if the tornado had winds that would give it a higher rating. Some NWS offices, however, have rated these tornadoes EFU (EF-Unknown) due to the lack of damage.[24]
-
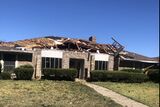
 EF0 damage: This house only sustained a minor loss of shingles. Though well-built structures are typically unscathed by EF0 tornadoes, falling trees and tree branches can injure and kill people, even inside a sturdy structure. Between 35 and 40% of all annual tornadoes in the U.S. are rated EF0.
 -
 EF1 damage: Cause major damage to mobile homes and automobiles, and can cause minor structural damage to well-constructed homes. This frame home sustained major roof damage but otherwise remained intact. Around 35% of all annual tornadoes in the U.S. are rated EF1.


Significant tornadoes
EF3 (T6–T7) damage is a serious risk to life and limb and the point at which a tornado statistically becomes significantly more destructive and deadly. Few parts of affected buildings are left standing; well-built structures lose all outer and some inner walls. Unanchored homes are swept away, and homes with poor anchoring may collapse entirely. Small vehicles and similarly sized objects are lifted off the ground and tossed as projectiles. Wooded areas suffer an almost total loss of vegetation, and some tree debarking may occur. Statistically speaking, EF3 is the maximum level that allows for reasonably effective residential sheltering in place in a first-floor interior room closest to the center of the house (the most widespread tornado sheltering procedure in America for those with no basement or underground storm shelter).
-
 EF2 damage: At this intensity, tornadoes have a more significant impact on well-built structures, removing the roofs, and collapsing some exterior walls of poorly built structures. EF2 tornadoes are capable of destroying mobile homes and generating large amounts of flying debris. This home completely lost its roof, but its walls remained intact. Between 15 and 19% of all annual tornadoes in the U.S. are rated EF2.
 -
 EF3 damage: Here, the roof and all but some inner walls of this frame home have been demolished. While taking shelter in a basement, cellar, or inner room improves one's odds of surviving a tornado drastically, occasionally even this is not enough. EF3 and stronger tornadoes only account for about 6% of all annual tornadoes in the United States, yet since 1980, they have accounted for more than 75% of tornado-related deaths.


Violent tornadoes
EF4 (T8–T9) damage typically results in a total loss of the affected structure. Well-built homes are reduced to a short pile of medium-sized debris on the foundation. Homes with poor or no anchoring are swept completely away. Large, heavy vehicles, including airplanes, trains, and large trucks, can be pushed over, flipped repeatedly, or picked up and thrown. Large, healthy trees are entirely debarked and snapped off close to the ground or uprooted altogether and turned into flying projectiles. Passenger cars and similarly sized objects can be picked up and flung for considerable distances. EF4 damage can be expected to level even the most robustly built homes, making the common practice of sheltering in an interior room on the ground floor of a residence insufficient to ensure survival. A storm shelter, bomb shelter, reinforced basement, or other subterranean shelter can provide substantial safety against EF4 tornadoes.[25]
EF5 (T10–T11) damage represents the upper limit of tornado power, and destruction is almost always total. An EF5 tornado pulls well-built, well-anchored homes off their foundations and into the air before obliterating them, flinging the wreckage for miles, and sweeping the foundation clean. Large, steel-reinforced structures such as schools are completely leveled. Tornadoes of this intensity tend to shred and scour low-lying grass and vegetation from the ground. Very little recognizable structural debris is generated by EF5 damage, with most materials reduced to a coarse mix of small, granular particles and dispersed evenly across the tornado's damage path. Large, multiple-ton steel frame vehicles and farm equipment are often mangled beyond recognition and tossed miles away or reduced entirely to unrecognizable parts. The official description of this damage highlights the extreme nature of the destruction, noting that "incredible phenomena will occur"; historically, this has included such displays of power as twisting skyscrapers, digging up large trenches into the ground, ripping roofs off of tornado bunkers, collapsing heavy oil rigs, leveling entire communities, derailing and tossing several train cars, and stripping asphalt from roadbeds. Despite their relative rarity, the damage caused by EF5 tornadoes represents a disproportionate hazard to life and limb; since 1950 in the United States, only 60 tornadoes (0.1% of all reports) have been designated F5 or EF5, and yet these have been responsible for more than 1,300 deaths and 14,000 injuries (21.5 and 13.6%, respectively).[17][26]
-
 EF4 damage: Brick home reduced to piles of rubble. Above-ground structures are almost completely vulnerable to EF4 tornadoes, which level well-built structures, toss heavy vehicles through the air, and uproot trees, turning them into flying missiles. Around 1.1% of annual tornadoes in the U.S. are rated EF4.
 -
![EF5 damage: These tornadoes cause destruction, obliterating and sweeping away almost anything in their paths, including those sheltering in open basements. However, they are extremely rare (making up less than 0.1% of annual tornadoes in the U.S.), and even a tornado rated as EF5 usually only produces EF5 damage across a relatively small portion of the damage path (with EF0-EF4 damage zones surrounding the central EF5 core).[27]](/wiki/images/thumb/c/ce/EF5damageMoore2013.jpg/160px-EF5damageMoore2013.jpg) EF5 damage: These tornadoes cause destruction, obliterating and sweeping away almost anything in their paths, including those sheltering in open basements. However, they are extremely rare (making up less than 0.1% of annual tornadoes in the U.S.), and even a tornado rated as EF5 usually only produces EF5 damage across a relatively small portion of the damage path (with EF0-EF4 damage zones surrounding the central EF5 core).[27]
EF5 damage: These tornadoes cause destruction, obliterating and sweeping away almost anything in their paths, including those sheltering in open basements. However, they are extremely rare (making up less than 0.1% of annual tornadoes in the U.S.), and even a tornado rated as EF5 usually only produces EF5 damage across a relatively small portion of the damage path (with EF0-EF4 damage zones surrounding the central EF5 core).[27]

![EF5 damage: These tornadoes cause destruction, obliterating and sweeping away almost anything in their paths, including those sheltering in open basements. However, they are extremely rare (making up less than 0.1% of annual tornadoes in the U.S.), and even a tornado rated as EF5 usually only produces EF5 damage across a relatively small portion of the damage path (with EF0-EF4 damage zones surrounding the central EF5 core).[27]](/wiki/File:EF5damageMoore2013.jpg)
Outbreak Intensity score
In late 2023, American meteorologist and tornado expert Thomas P. Grazulis created the Outbreak Intensity Score (OIS) as a way to rank tornado outbreaks.[28][29] For the score, only significant tornadoes are counted: F2/EF2 tornadoes receive 2 points each, F3/EF3 tornadoes receive 5 points each, F4/EF4 tornadoes receive 10 points each, and F5/EF5 tornadoes receive 15 points each.[28] The number of total points determine the rating for the outbreak, which is broken up into seven categories.[28]
| Type of outbreak | Weak | Minor | Significant | Major | Devastating | Historic | Super |
|---|---|---|---|---|---|---|---|
| Number of points |
2–6 | 7–10 | 11–29 | 30–79 | 80–119 | 120–249 | 250+ |
Lists of outbreaks
Super outbreaks
There have been three tornado outbreaks which scored more than 250 points on the OIS, reaching the status of "Super Outbreak".[28]
| Outbreak | OIS score | # of (E)F2s | # of (E)F3s | # of (E)F4s | # of (E)F5s | Total tornadoes | Deaths | Injuries | References |
|---|---|---|---|---|---|---|---|---|---|
| 1974 Super Outbreak | 578 | 34 | 35 | 23 | 7 | 148 | 319 | 5,454
| |
| 2011 Super Outbreak | 383 | 49 | 23 | 11 | 4 | 368 | 324 | 2,892 | [28][30][31][32] |
| Tornado outbreak sequence of May 25 – June 1, 1917 | 296 | 28 | 17 | 14 | 1 | 66+ | 383+ | 746+ |
Historic outbreaks
There have been 44 tornado outbreaks which scored at least 120 points, but less than 249 on the OIS, reaching the status of "Historic Outbreak".[28]
| Outbreak | OIS score | # of (E)F2s | # of (E)F3s | # of (E)F4s | # of (E)F5s | Total tornadoes | Deaths | Injuries | References |
|---|---|---|---|---|---|---|---|---|---|
| 1965 Palm Sunday tornado outbreak | 238 | 14 | 6 | 18 | 0 | 55 | 266 | 3,662 | |
| Tornado outbreak sequence of May 2003 | 232 | 36 | 20 | 6 | 0 | 363 | 42 | 652 | [28][33][34] |
| Tornado outbreak sequence of May 14–31, 1962 | 209 | 47 | 15 | 4 | 0 | 188 | 3 | 168 | |
| Tornado outbreak sequence of May 1896 | 199 | 17 | 12 | 6 | 3 | 38+ | 501+ | 1,914+ | |
| Tornado outbreak sequence of May 6–27, 1995 | 188 | 39 | 14 | 4 | 0 | 279 | 13 | 500+ | [28] |
| Tornado outbreak of November 21–23, 1992 | 187 | 26 | 15 | 6 | 0 | 95 | 26 | 641 | [28][35][36][37] |
| Tornado outbreak of June 14–18, 1992 | 186 | 33 | 15 | 3 | 1 | 170 | 1 | 110 | [28][38][39] |
| Tornado outbreak of April 2–3, 1956 | 185 | 25 | 8 | 8 | 1 | 55 | 39 | 790 | |
| 1932 Deep South tornado outbreak | 182 | 16 | 10 | 10 | 0 | 38 | 330 | 2,141 | [40][41] |
| Tornado outbreak sequence of May 1982 | 174 | 42 | 16 | 1 | 0 | 329 | 14 | 18+ | [28] |
| Tornado outbreak sequence of May 22–31, 1973 | 172 | 41 | 10 | 4 | 0 | 145 | 24 | 820 | [28][34][42] |
| Tornado outbreak of May 1927 | 169 | 17 | 8 | 8 | 1 | 34+ | 217+ | 1,156+ | |
| Tornado outbreak of March 21–22, 1952 | 169 | 7 | 11 | 10 | 0 | 30 | 204 | 1,155 | [28][43] |
| Early May 1965 tornado outbreak | 169 | 22 | 6 | 8 | 1 | 72 | 17 | 770 | |
| 1985 United States–Canada tornado outbreak | 169 | 7 | 12 | 8 | 1 | 44 | 90 | 875 | [28][44][45] |
| Tornado outbreak sequence of May 21–26, 2011 | 162 | 31 | 8 | 3 | 2 | 239 | 178 | 1,630 | [28][46] |
| Tornado outbreak of April 20–22, 1912 | 159 | 12 | 9 | 9 | 0 | 32+ | 56+ | 410+ | |
| May 1960 tornado outbreak sequence | 157 | 26 | 10 | 4 | 1 | 71 | 33 | 302 | [28][47] |
| Tornado outbreak of March 16–17, 1942 | 156 | 8 | 13 | 6 | 1 | 30+ | 149 | 1,312+ | |
| Tornado outbreak sequence of April 25 – May 3, 1954 | 154 | 37 | 10 | 3 | 0 | 100 | 4 | 167 | |
| Tornado outbreak sequence of March 18–27, 1948 | 153 | 19 | 11 | 6 | 0 | 36 | 80 | 896 | |
| 1920 Palm Sunday tornado outbreak | 150 | 15 | 8 | 8 | 0 | 37+ | 153+ | 1,215+ | |
| Tornado outbreak of March 13–16, 2025 | 147 | 31 | 11 | 3 | 0 | 117 | 23 | 65+ | |
| Tornado outbreak sequence of May 1983 | 146 | 33 | 16 | 0 | 0 | 157 | 6 | 2+ | [28] |
| 1999 Great Plains tornado outbreak | 145 | 20 | 10 | 4 | 1 | 152 | 50 | 895 | [28][48][34] |
| Tornado outbreak of April 29 – May 1, 1909 | 140 | 30 | 8 | 4 | 0 | 43+ | 181+ | 770+ | |
| Tornado outbreak sequence of April 18–27, 1957 | 140 | 30 | 8 | 4 | 0 | 117 | 2 | 33 | |
| Tornado outbreak sequence of May 4–8, 1964 | 140 | 35 | 7 | 2 | 1 | 73 | 15 | 383 | |
| Enigma tornado outbreak | 135 | 25 | 9 | 4 | 0 | 51+ | 180+ | 1,056+ | [49] |
| 2020 Easter tornado outbreak | 133 | 19 | 13 | 3 | 0 | 141 | 32 | 257 | [28][50][51][52] |
| Tornado outbreak of April 27–29, 1912 | 130 | 10 | 6 | 8 | 0 | 26 | 47+ | 175+ | |
| Tornado outbreak of March 31 – April 1, 2023 | 129 | 32 | 11 | 1 | 0 | 147 | 26 | 218+ | [28][53] |
| Tornado outbreak of April 14–16, 2011 | 129 | 32 | 13 | 0 | 0 | 178 | 38 | 588 | [28] |
| June 1990 Lower Ohio Valley tornado outbreak | 129 | 17 | 5 | 7 | 0 | 66 | 9 | 253 | [28] |
| Tornado outbreak of April 2–3, 1982 | 128 | 14 | 11 | 3 | 1 | 63 | 30 | 433 | |
| Tornado outbreak sequence of April 19–21, 1973 | 127 | 26 | 9 | 3 | 0 | 68 | 2 | 106 | [28] |
| Flint–Worcester tornado outbreak sequence | 126 | 13 | 7 | 5 | 1 | 50 | 251 | 2,619 | |
| March 1990 Central United States tornado outbreak | 126 | 13 | 10 | 2 | 2 | 64 | 2 | 89 | |
| 1991 Great Plains tornado outbreak | 126 | 18 | 7 | 4 | 1 | 55 | 21 | 313 | [28] |
| 1908 Dixie tornado outbreak | 124 | 22 | 3 | 5 | 1 | 31+ | 324+ | 1,720+ | |
| Tornado outbreak sequence of May 3–9, 1961 | 123 | 29 | 9 | 2 | 0 | 73 | 23 | 126 | |
| Tornado outbreak sequence of December 18–20, 1957 | 122 | 16 | 9 | 3 | 1 | 37 | 19 | 291 | |
| May 1957 Central Plains tornado outbreak sequence | 120 | 20 | 7 | 3 | 1 | 57 | 59 | 341 |
Devastating outbreaks
There have been several tornado outbreaks which scored at least 80 points, but less than 120 on the OIS, reaching the status of "Devastating Outbreak".[28]
| Outbreak | OIS score | # of (E)F2s | # of (E)F3s | # of (E)F4s | # of (E)F5s | Total tornadoes | Deaths | Injuries | References |
|---|---|---|---|---|---|---|---|---|---|
| Tornado outbreak of June 5–6, 1916 | 115 | 20 | 13 | 1 | 0 | 35+ | 143+ | 756+ | |
| Tornado outbreak of March 27, 1890 | 114 | 12 | 6 | 6 | 0 | 24+ | 187+ | 846+ | |
| 1984 Carolinas tornado outbreak | 109 | 7 | 5 | 7 | 0 | 24 | 57 | 1,249 | [28] |
| 2008 Super Tuesday tornado outbreak | 107 | 16 | 5 | 5 | 0 | 87 | 57 | 425 | [28] |
| Tornado outbreak sequence of May 2004 | 106 | 23 | 8 | 2 | 0 | 389 | 7 | 123 | [28][54] |
| Tornado outbreak of May 1968 | 105 | 10 | 7 | 2 | 2 | 46 | 72 | 1,203 | |
| Tornado outbreak of March 20–21, 1976 | 104 | 17 | 8 | 3 | 0 | 66 | 3 | 189 | [28] |
| Tornado outbreak sequence of May 4–10, 1933 | 102 | 16 | 8 | 3 | 0 | 33+ | 128 | 644+ | |
| Tornado outbreak sequence of April 2–5, 1957 | 102 | 26 | 6 | 2 | 0 | 73 | 21 | 341 | |
| March 1875 Southeast tornado outbreak | 101 | 3 | 5 | 7 | 0 | 19+ | 96+ | 377+ | |
| April 1924 tornado outbreak | 101 | 13 | 11 | 2 | 0 | 28+ | 114 | 1,166+ | |
| Tornado outbreak of April 30 – May 2, 1967 | 101 | 21 | 4 | 4 | 0 | 38 | 13 | 90 | |
| Tornado outbreak of November 17, 2013 | 101 | 23 | 7 | 2 | 0 | 77 | 8 | 190+ | [28] |
| Tornado outbreak of April 15–16, 1998 | 100 | 10 | 7 | 3 | 1 | 63 | 12 | 120 | [28] |
| 1967 Oak Lawn tornado outbreak | 99 | 17 | 3 | 5 | 0 | 45 | 58 | 1,418 | |
| Tornado outbreak of May 22–27, 2008 | 98 | 14 | 9 | 1 | 1 | 173 | 13 | 215 | [28] |
| Tornado outbreak of April 1880 | 97 | 16 | 3 | 5 | 0 | 25+ | 166+ | 516+ | |
| Tornado outbreak sequence of March 9–13, 2006 | 97 | 16 | 11 | 1 | 0 | 99 | 10 | 183 | [28][55] |
| Tornado outbreak of April 27–30, 2014 | 97 | 16 | 9 | 2 | 0 | 82 | 35 | 447 | [28] |
| Tornado outbreak and floods of April 2–7, 2025 | 96 | 33 | 6 | 0 | 0 | 157 | 9 | 47+ | |
| Tornado outbreak sequence of May 8–12, 1959 | 95 | 20 | 7 | 2 | 0 | 60 | 7 | 34 | |
| Tornado outbreak of April 12, 1945 | 94 | 7 | 5 | 4 | 1 | 17 | 128 | 1,001 | [56][57][58] |
| Tornado outbreak sequence of May 1971 | 94 | 22 | 8 | 1 | 0 | 76 | 6 | 242 | [56] |
| Tornado outbreak sequence of June 21–26, 1969 | 93 | 14 | 7 | 3 | 0 | 63 | 7 | 65+ | |
| Tornado outbreak sequence of April 1996 | 93 | 19 | 11 | 0 | 0 | 118 | 6 | 200+ | [28] |
| Tornado outbreak of March 2–3, 2012 | 93 | 14 | 9 | 2 | 0 | 70 | 41 | 300+ | [28] |
| 1953 Waco tornado outbreak | 91 | 8 | 4 | 4 | 1 | 33 | 144 | 895 | |
| Tornado outbreak of June 7–8, 1984 | 91 | 23 | 4 | 1 | 1 | 46 | 13 | 322 | [28] |
| Tornado outbreak sequence of May 7–11, 2008 | 91 | 23 | 5 | 2 | 0 | 120 | 25 | 419 | [28] |
| 1979 Red River Valley tornado outbreak | 90 | 25 | 4 | 2 | 0 | 61 | 58 | 1,927 | [28] |
| 2002 Veterans Day weekend tornado outbreak | 90 | 20 | 8 | 1 | 0 | 76 | 36 | 303 | [28] |
| Tornado outbreak of June 16–18, 2014 | 89 | 12 | 3 | 5 | 0 | 76 | 2 | 28 | [28] |
| Tornado outbreak of April 21–23, 1883 | 87 | 11 | 5 | 4 | 0 | 29+ | 122+ | 771+ | |
| Tornado outbreak sequence of June 9–14, 1967 | 87 | 26 | 3 | 2 | 0 | 103 | 5 | 15+ | |
| Tornado outbreak of April 25–28, 2024 | 87 | 16 | 7 | 2 | 0 | 162 | 6 | 156+ | |
| Tornado outbreak sequence of March 26–31, 1961 | 86 | 18 | 10 | 0 | 0 | 47 | 3 | 80 | |
| 1913 Easter tornado outbreak | 85 | 5 | 3 | 6 | 0 | 15+ | 192 | 853+ | |
| Tornado outbreak of May 25–30, 2019 | 85 | 15 | 7 | 2 | 0 | 182 | 3 | 239 | [28][59][60] |
| Tornado outbreak of March 13–14, 1913 | 84 | 12 | 6 | 3 | 0 | 23+ | 76+ | 301+ | |
| 1936 Tupelo–Gainesville tornado outbreak | 84 | 2 | 7 | 3 | 1 | 14+ | 454+ | 2,498+ | |
| Tornado outbreak of November 23–24, 2001 | 83 | 19 | 3 | 3 | 0 | 69 | 13 | 219 | [28] |
| April 1920 tornado outbreak | 82 | 6 | 2 | 6 | 0 | 17+ | 243+ | 1,374+ | |
| Tornado outbreak of December 10–11, 2021 | 82 | 16 | 6 | 2 | 0 | 71 | 89 | 676 | [28][61] |
| 1955 Great Plains tornado outbreak | 81 | 13 | 3 | 1 | 2 | 48 | 102 | 554 | |
| Tornado outbreak sequence of June 1966 | 81 | 18 | 2 | 2 | 1 | 57 | 18 | 543 | |
| Tornado outbreak sequence of June 10–16, 1970 | 81 | 18 | 7 | 1 | 0 | 82 | 3 | 73 | [56] |
| Tornado outbreak of June 8, 1974 | 81 | 8 | 9 | 2 | 0 | 36 | 22 | 477 | [28] |
| Tornado outbreak of January 21–23, 1999 | 81 | 13 | 9 | 1 | 0 | 128 | 9 | 162 | [28][62] |
| 1886 St. Cloud–Sauk Rapids tornado outbreak | 80 | 10 | 4 | 4 | 0 | 18+ | 87+ | 324+ | |
| 1967 St. Louis tornado outbreak | 80 | 15 | 6 | 2 | 0 | 30 | 7 | 268 | |
| Tornado outbreak sequence of April 17–19, 1970 | 80 | 10 | 2 | 5 | 0 | 33 | 26 | 68 | [56] |
Major outbreaks
There have been several tornado outbreaks which scored at least 30 points, but 79 or less on the OIS, reaching the status of "Major Outbreak".[28]
| Outbreak | OIS score | # of (E)F2s | # of (E)F3s | # of (E)F4s | # of (E)F5s | Total tornadoes | Deaths | Injuries | References |
|---|---|---|---|---|---|---|---|---|---|
| Tornado outbreak sequence of April 28 – May 2, 1953 | 79 | 7 | 3 | 5 | 0 | 24 | 36 | 361 | |
| Tornado outbreak of April 9–11, 2009 | 79 | 12 | 9 | 1 | 0 | 85 | 5 | 112 | [28] |
| June 2010 Northern Plains tornado outbreak | 78 | 9 | 4 | 4 | 0 | 93 | 3 | 43 | [28] |
| Tornado outbreak of April 28–30, 1963 | 77 | 16 | 7 | 1 | 0 | 37 | 13 | 72 | |
| Tornado outbreak of April 18–21, 1974 | 76 | 18 | 6 | 1 | 0 | 36 | 2 | 1+ | [28] |
| Tornado outbreak of May 25–27, 2024 | 76 | 13 | 10 | 0 | 0 | 97 | 15 | 174 | |
| Tornado outbreak of May 18–21, 2025 | 76 | 13 | 10 | 0 | 0 | 133 | 0 | 12+ | |
| Tornado outbreak of June 1881 | 74 | 2 | 4 | 5 | 0 | 11+ | 20+ | 141+ | |
| Tornado outbreak of March 28–31, 1976 | 73 | 14 | 5 | 2 | 0 | 35 | 10 | 1+ | [28] |
| Tornado outbreak of April 30 – May 1, 1949 | 71 | 8 | 9 | 1 | 0 | 24+ | 10 | 103 | |
| March 1997 tornado outbreak | 71 | 8 | 5 | 3 | 0 | 39 | 27 | 464 | [28][63][64] |
| Tornado outbreak of May 4–6, 2007 | 70 | 15 | 5 | 0 | 1 | 132 | 14 | 89 | [28] |
| Tornado outbreak of May 23–24, 1946 | 69 | 7 | 5 | 3 | 0 | 17+ | 4 | 42 | |
| 1980 Grand Island tornado outbreak | 68 | 9 | 4 | 3 | 0 | 29 | 6 | 413 | [28] |
| Tornado outbreak sequence of May 22–26, 2016 | 68 | 9 | 8 | 1 | 0 | 98 | 0 | 11+ | [28] |
| Tornado outbreak of May 2, 1942 | 67 | 1 | 1 | 6 | 0 | 8+ | 31 | 172+ | |
| Tornado outbreak of May 20–21, 1949 | 67 | 6 | 3 | 4 | 0 | 46+ | 56 | 0+ | |
| Tornado outbreak of May 6–8, 1973 | 66 | 23 | 1 | 0 | 1 | 47 | 2 | 41 | [56] |
| Late-May 1998 tornado outbreak and derecho | 66 | 13 | 6 | 1 | 0 | 60 | 7 | 233+ | |
| Tornado outbreak of April 8–9, 1999 | 66 | 8 | 4 | 3 | 0 | 54 | 6 | 100 | [28] |
| Tornado outbreak of May 10–13, 2010 | 66 | 13 | 4 | 2 | 0 | 91 | 3 | 127 | [28] |
| December 2021 Midwest derecho and tornado outbreak | 66 | 33 | 0 | 0 | 0 | 120 | 5 | 3 | [28] |
| Tornado outbreak of April 9, 1919 | 65 | 5 | 3 | 4 | 0 | 12 | 92+ | 412 | |
| Tornado outbreak sequence of November 13–17, 1958 | 65 | 20 | 5 | 0 | 0 | 43 | 0 | 37 | |
| Tornado outbreak of June 7–9, 1993 | 65 | 10 | 5 | 2 | 0 | 107 | 1 | 1+ | [28] |
| Tornado outbreak of February 21–22, 1971 | 64 | 7 | 3 | 2 | 1 | 19+ | 123 | 1,592 | [56] |
| Tornado outbreak of April 27–28, 2002 | 64 | 12 | 6 | 1 | 0 | 48 | 6 | 256 | [28] |
| Tornado outbreak of February 11–13, 1950 | 63 | 14 | 5 | 1 | 0 | 24 | 41+ | 228 | |
| 1975 Omaha tornado outbreak | 63 | 14 | 3 | 2 | 0 | 36 | 3 | 137+ | [28] |
| 1994 Palm Sunday tornado outbreak | 63 | 4 | 7 | 2 | 0 | 29 | 40 | 491 | [28] |
| Tornado outbreak of February 28 – March 2, 2007 | 63 | 9 | 3 | 3 | 0 | 57 | 20 | 98 | [28] |
| Tornado outbreak sequence of June 3–11, 2008 | 63 | 14 | 5 | 1 | 0 | 192 | 7 | 84 | [28] |
| Tornado outbreak of March 12–15, 1953 | 62 | 11 | 6 | 1 | 0 | 23 | 21 | 72 | |
| Tornado outbreak of April 23–27, 1970 | 62 | 11 | 6 | 1 | 0 | 34 | 3 | 26+ | [56] |
| Tornado outbreak of December 23–25, 1982 | 62 | 16 | 4 | 1 | 0 | 44 | 1 | 11+ | [28] |
| Tornado outbreak sequence of May 30 – June 3, 1954 | 61 | 18 | 3 | 1 | 0 | 39 | 9 | 65 | |
| Tornado outbreak of April 8, 1957 | 61 | 8 | 5 | 2 | 0 | 18 | 7 | 203 | |
| Tornado outbreak of December 17–21, 1967 | 61 | 13 | 5 | 1 | 0 | 30 | 6 | 110 | |
| Tornado outbreak of April 21–24, 1968 | 61 | 8 | 2 | 2 | 1 | 26 | 14 | 525 | |
| Tornado outbreak sequence of December 1–6, 1953 | 60 | 10 | 3 | 1 | 1 | 19 | 49 | 404 | |
| Tornado outbreak of April 2–4, 1968 | 60 | 15 | 2 | 2 | 0 | 31 | 12 | 0+ | |
| Tornado outbreak of April 19–22, 1972 | 60 | 10 | 6 | 1 | 0 | 28 | 8 | 42 | [56] |
| Tri-State tornado outbreak | 59 | 2 | 4 | 2 | 1 | 12+ | 751 | 2,298 | |
| Tornado outbreak sequence of April 23–30, 1961 | 59 | 12 | 5 | 1 | 0 | 30 | 3 | 38 | |
| Tornado outbreak sequence of June 17–23, 1964 | 59 | 12 | 5 | 1 | 0 | 52 | 0 | 37 | |
| Tornado outbreak of March 25–26, 1949 | 58 | 9 | 4 | 2 | 0 | 15+ | 25+ | 180+ | |
| Tornado outbreak sequence of April 26–30, 1971 | 58 | 9 | 4 | 2 | 0 | 30 | 10 | 187 | [56] |
| Tornado outbreak of April 22–25, 2010 | 58 | 9 | 4 | 2 | 0 | 88 | 10 | 184 | [28] |
| Tornado outbreak sequence of April 5–8, 1954 | 57 | 11 | 5 | 1 | 0 | 25 | 1 | 22 | |
| Hurricane Carla tornado outbreak | 57 | 6 | 7 | 1 | 0 | 21 | 14 | 337 | |
| Tornado outbreak of March 13–17, 1982 | 57 | 11 | 7 | 0 | 0 | 23 | 4 | 1+ | [28] |
| Tornado outbreak sequence of May 15–16, 2025 | 57 | 11 | 3 | 2 | 0 | 55 | 27 | 38-45 | |
| Tornado outbreak of February 5–6, 1942 | 56 | 18 | 4 | 0 | 0 | 22+ | 15 | 114 | |
| Tornado outbreak of March 26, 1976 | 56 | 3 | 3 | 2 | 1 | 17 | 4 | 89 | [28] |
| Tornado outbreak sequence of April 12–18, 1960 | 55 | 10 | 7 | 0 | 0 | 37 | 4 | 60 | |
| Tornado outbreak of April 28–30, 1947 | 54 | 7 | 4 | 2 | 0 | 13+ | 24+ | 0+ | |
| Tornado outbreak sequence of July 1–10, 1955 | 54 | 7 | 2 | 3 | 0 | 28 | 4 | 48 | |
| Tornado outbreak sequence of January 7–11, 2008 | 54 | 7 | 8 | 0 | 0 | 73 | 4 | 62 | [28] |
| Tornado outbreak of May 26–31, 2013 | 54 | 12 | 6 | 0 | 0 | 134 | 9 | 172 | [28] |
| Tornado outbreak of November 7–8, 1957 | 53 | 9 | 5 | 1 | 0 | 28 | 12 | 213 | |
| Tornado outbreak sequence of March 4–8, 1961 | 53 | 14 | 5 | 0 | 0 | 44 | 2 | 152 | |
| Tornado outbreak sequence of April 29 – May 2, 1972 | 53 | 4 | 7 | 1 | 0 | 21 | 0 | 12 | [56] |
| Tornado outbreak of November 20–21, 1900 | 52 | 6 | 4 | 2 | 0 | 14+ | 97+ | 388+ | |
| Tornado outbreak of November 16–19, 1957 | 52 | 11 | 2 | 2 | 0 | 32 | 10 | 84 | |
| 1967 Hurricane Beulah tornado outbreak | 52 | 6 | 8 | 0 | 0 | 120 | 5 | 41 | |
| 2009 South American tornado outbreak | 52 | 6 | 4 | 2 | 0 | 28 | 15 | 1+ | [65][66][67][68] |
| Tornado outbreak of January 4–6, 1946 | 51 | 3 | 3 | 3 | 0 | 10+ | 47 | 412+ | |
| Tornado outbreak of October 14–15, 1966 | 51 | 13 | 2 | 0 | 1 | 23 | 6 | 225 | |
| Tornado outbreak of May 6–10, 2024 | 51 | 13 | 3 | 1 | 0 | 162 | 3 | 87-91+ | [69] |
| Tornado outbreak of January 29–30, 1947 | 50 | 10 | 4 | 1 | 0 | 15+ | 13+ | 24+ | |
| Tornado outbreak sequence of May 12–17, 1957 | 50 | 10 | 4 | 1 | 0 | 50 | 23 | 105 | |
| Tornado outbreak of May 18–21, 2013 | 50 | 5 | 1 | 2 | 1 | 78 | 26 | 229 | [28] |
| Tornado outbreak sequence of March 24–28, 2021 | 50 | 10 | 4 | 1 | 0 | 43 | 7 | 37+ | [28] |
| Tornado outbreak sequence of September 26–29, 1959 | 49 | 12 | 1 | 2 | 0 | 36 | 2 | 47 | |
| 2012 Leap Day tornado outbreak | 49 | 17 | 1 | 1 | 0 | 42 | 15 | 193 | [28] |
| Tornado outbreak sequence of May 17–20, 1960 | 48 | 9 | 2 | 2 | 0 | 63 | 1 | 108 | |
| 2003 South Dakota tornado outbreak | 48 | 9 | 2 | 2 | 0 | 125 | 2 | 19 | [28] |
| Tornado outbreak of January 3, 1949 | 47 | 6 | 5 | 1 | 0 | 14+ | 60+ | 504 | |
| Tornado outbreak of March 24–25, 1954 | 47 | 16 | 1 | 1 | 0 | 28 | 2 | 11 | |
| 1944 Appalachians tornado outbreak | 47 | 1 | 3 | 3 | 0 | 7+ | 154+ | 1,044 | |
| Tornado outbreak of March 10–12, 1963 | 47 | 11 | 1 | 2 | 0 | 18 | 6 | 38 | |
| Tornado outbreak of April 12–14, 1964 | 47 | 6 | 3 | 2 | 0 | 23 | 7 | 75 | |
| 1967 European tornado outbreak | 47 | 1 | 4 | 1 | 1 | 8+ | 17 | 80+ | |
| Tornado outbreak of December 1–3, 1982 | 47 | 6 | 7 | 0 | 0 | 38 | 2 | 0+ | [28] |
| 2008 Atlanta tornado outbreak | 47 | 16 | 3 | 0 | 0 | 46 | 3 | 53 | [28] |
| Tornado outbreak of June 5–6, 2010 | 47 | 11 | 3 | 1 | 0 | 53 | 8 | 68 | [28] |
| Tornado outbreak sequence of May 15–20, 1946 | 46 | 3 | 2 | 3 | 0 | 8+ | 8+ | 53+ | |
| Tornado outbreak of June 3–4, 1958 | 46 | 3 | 1 | 2 | 1 | 13 | 28 | 175 | |
| 1997 Central Texas tornado outbreak | 46 | 3 | 3 | 1 | 1 | 20 | 28 | 30 | [28] |
| Tornado outbreak of April 2, 2006 | 46 | 8 | 6 | 0 | 0 | 66 | 27 | 348 | [28][70] |
| Tornado outbreak of April 9–11, 2011 | 46 | 8 | 4 | 1 | 0 | 49 | 0 | 21 | [28] |
| Tornado outbreak sequence of May 5–10, 2015 | 46 | 8 | 6 | 0 | 0 | 127 | 5 | 67 | [28] |
| Tornado outbreak of March 16–18, 1965 | 45 | 5 | 5 | 1 | 0 | 24 | 2 | 129 | |
| Tornado outbreak of June 13, 1976 | 45 | 5 | 2 | 1 | 1 | 16 | 2 | 1+ | [28] |
| Tornado outbreak of April 1977 | 45 | 10 | 2 | 0 | 1 | 22 | 24 | 158 | [28] |
| May 1989 tornado outbreak | 45 | 5 | 1 | 3 | 0 | 16 | 7 | 168 | [28] |
| Tornado outbreak of November 22–24, 2004 | 45 | 15 | 3 | 0 | 0 | 104 | 4 | 39 | [28][71][72][73] |
| Tornado outbreak of October 17–19, 2007 | 45 | 15 | 3 | 0 | 0 | 63 | 5 | 28 | [28] |
| Tornado outbreak of March 28–31, 2007 | 45 | 10 | 5 | 0 | 0 | 81 | 5 | 26 | [28] |
| Tornado outbreak sequence of April 19–24, 2011 | 45 | 15 | 1 | 1 | 0 | 134 | 0 | 14 | [28] |
| Tornado outbreak of April 4–7, 2022 | 45 | 10 | 3 | 1 | 0 | 89 | 1 | 17+ | [28] |
| Tornado outbreak of December 12–15, 2022 | 45 | 20 | 1 | 0 | 0 | 77 | 3 | 64 | [28] |
| Tornado outbreak sequence of April 21–24, 1955 | 44 | 12 | 2 | 1 | 0 | 27 | 6 | 29 | |
| Tornado outbreak of December 14–15, 1971 | 44 | 17 | 2 | 0 | 0 | 40 | 2 | 119 | [56] |
| Tornado outbreak of April 25–27, 1982 | 44 | 7 | 6 | 0 | 0 | 13+ | 0 | 0+ | [28] |
| Tornado outbreak of November 4–5, 2022 | 44 | 7 | 2 | 2 | 0 | 31 | 2 | 34+ | [28] |
| 1929 Rye Cove tornado outbreak | 43 | 9 | 5 | 0 | 0 | 17 | 42+ | 323+ | |
| Great Storm of 1975 | 43 | 14 | 1 | 1 | 0 | 45 | 12 | 377 | [28] |
| Tornado outbreak of April 23, 2000 | 43 | 14 | 3 | 0 | 0 | 33 | 0 | 12 | [28] |
| Tornado outbreak of June 18–22, 2011 | 43 | 9 | 5 | 0 | 0 | 78 | 0 | 4 | [28] |
| Tornado outbreak of December 16–17, 2019 | 43 | 9 | 5 | 0 | 0 | 41 | 3 | 14+ | [28] |
| Tornado outbreak sequence of April 2–8, 1964 | 42 | 11 | 1 | 0 | 1 | 33 | 7 | 119 | |
| Tornado outbreak of November 25–27, 1965 | 42 | 6 | 6 | 0 | 0 | 18 | 1 | 26 | |
| Tornado outbreak of February 22–24, 1975 | 42 | 11 | 2 | 1 | 0 | 23 | 3 | 1+ | [28] |
| Tornado outbreak of May 22–23, 1981 | 42 | 11 | 2 | 1 | 0 | 43 | 0 | 12 | [28] |
| Tornado outbreak of May 7–10, 2016 | 42 | 6 | 4 | 1 | 0 | 57 | 2 | 19 | [28] |
| 1947 Glazier–Higgins–Woodward tornado outbreak | 41 | 8 | 0 | 1 | 1 | 12+ | 185+ | 990+ | |
| Tornado outbreak of May 24–25, 1957 | 41 | 8 | 3 | 1 | 0 | 45 | 4 | 10 | |
| Tornado outbreak of April 28–30, 1960 | 41 | 8 | 5 | 0 | 0 | 19 | 3 | 79 | |
| Tornado outbreak of April 19, 1976 | 41 | 8 | 2 | 0 | 1 | 16 | 0 | 11 | [28] |
| Hurricane Ivan tornado outbreak | 41 | 18 | 1 | 0 | 0 | 120 | 7 | 24+ | [28][74] |
| Tornado outbreak of April 13–16, 2012 | 41 | 3 | 5 | 1 | 0 | 113 | 6 | 101 | [28] |
| Tornado outbreak of February 28 – March 1, 2017 | 41 | 8 | 3 | 1 | 0 | 71 | 4 | 38 | [28] |
| Tornado outbreak of March 21–23, 2022 | 41 | 13 | 3 | 0 | 0 | 85 | 3 | 68 | [28] |
| 1936 Cordele–Greensboro tornado outbreak | 40 | 5 | 0 | 3 | 0 | 13+ | 49+ | 149+ | |
| Tornado outbreak of April 18, 1969 | 40 | 5 | 4 | 1 | 0 | 15 | 2 | 0+ | |
| Tornado outbreak of April 25–27, 1994 | 40 | 10 | 0 | 2 | 0 | 101 | 6 | 1+ | [28] |
| Tornado outbreak of April 13–15, 2019 | 40 | 15 | 2 | 0 | 0 | 75 | 3 | 65 | [28] |
| Tornado outbreak of March 12–13, 1961 | 39 | 12 | 3 | 0 | 0 | 25 | 2 | 84 | |
| Tornado outbreak of September 24–25, 1973 | 39 | 2 | 5 | 1 | 0 | 8 | 3 | 66 | [56] |
| Tornado outbreak of April 6–9, 1998 | 39 | 7 | 2 | 0 | 1 | 62 | 41 | 250+ | [28] |
| Tornado outbreak of November 15, 2005 | 39 | 7 | 3 | 1 | 0 | 49 | 1 | 108 | [28] |
| Tornado outbreak of November 27–28, 2005 | 39 | 12 | 3 | 0 | 0 | 73 | 2 | 15 | [28] |
| Tornado outbreak of April 30 – May 2, 2010 | 39 | 12 | 3 | 0 | 0 | 60 | 5 | 31 | [28] |
| Tornado outbreak of May 17–18, 2019 | 39 | 7 | 5 | 0 | 0 | 46 | 0 | 4 | |
| Tornado outbreak of May 20–23, 2019 | 39 | 7 | 5 | 0 | 0 | 114 | 4 | 37 | |
| Tornado outbreak of June 4–5, 1955 | 38 | 4 | 2 | 2 | 0 | 46 | 0 | 0 | |
| Tornado outbreak sequence of May 12–14, 1956 | 38 | 9 | 0 | 2 | 0 | 19 | 4 | 162 | |
| Tornado outbreak of March 31 – April 2, 1959 | 38 | 4 | 4 | 1 | 0 | 17 | 7 | 83 | |
| Tornado outbreak of July 1–3, 1997 | 38 | 9 | 4 | 0 | 0 | 52 | 2 | 100 | [28] |
| Tornado outbreak of March 6–8, 1956 | 37 | 11 | 1 | 1 | 0 | 17 | 1 | 42 | |
| Tornado outbreak of February 13, 1952 | 37 | 6 | 3 | 1 | 0 | 15 | 5 | 102 | |
| Tornado outbreak sequence of April 1–6, 1958 | 37 | 6 | 5 | 0 | 0 | 32 | 3 | 40 | |
| Tornado outbreak of May 10, 1985 | 37 | 1 | 3 | 2 | 0 | 10 | 0+ | 0+ | |
| Tornado outbreak of May 30 – June 1, 1999 | 37 | 6 | 5 | 0 | 0 | 59 | 3 | 1+ | [28] |
| Tornado outbreak of April 10–11, 2001 | 37 | 16 | 1 | 0 | 0 | 79 | 4 | 18 | [28] |
| Tornado outbreak of January 21–23, 2017 | 37 | 11 | 3 | 0 | 0 | 81 | 20 | 204 | [28] |
| Tornado outbreak of March 24–27, 2023 | 37 | 6 | 3 | 1 | 0 | 35 | 23 | 236 | [28][75][76] |
| Tornado outbreak of March 20–21, 1913 | 36 | 13 | 0 | 1 | 0 | 16+ | 53 | 156+ | |
| 1944 South Dakota–Minnesota tornado outbreak | 36 | 3 | 1 | 1 | 1 | 6+ | 13+ | 560+ | |
| Tornado outbreak of February 12, 1945 | 36 | 3 | 4 | 1 | 0 | 8 | 45 | 427 | [56][77] |
| Tornado outbreak of October 29–30, 1956 | 36 | 3 | 4 | 1 | 0 | 16 | 0 | 7 | |
| Tornado outbreak of August 6, 1969 | 36 | 8 | 2 | 1 | 0 | 14 | 15+ | 109 | |
| March 1917 tornado outbreak | 35 | 5 | 3 | 1 | 0 | 9+ | 47+ | 300+ | |
| Tornado outbreak of November 15–16, 1955 | 35 | 5 | 5 | 0 | 0 | 18 | 1 | 35 | |
| Tornado outbreak of April 1–2, 1974 | 35 | 10 | 3 | 0 | 0 | 23 | 4 | 72 | [28] |
| 1985 Hurricane Danny tornado outbreak | 35 | 10 | 3 | 0 | 0 | 46 | 1 | 7+ | |
| Tornado outbreak of May 1–3, 2008 | 35 | 10 | 3 | 0 | 0 | 60 | 6 | 45 | [28] |
| Tornado outbreak of March 9–11, 1973 | 34 | 7 | 2 | 1 | 0 | 16 | 7 | 132 | [56] |
| Tornado outbreak of March 10–12, 1986 | 34 | 12 | 2 | 0 | 0 | 41 | 6 | 122 | |
| Tornado outbreak of June 2, 1998 | 34 | 7 | 2 | 1 | 0 | 33 | 22 | 77 | [28] |
| 2008 Poland tornado outbreak | 34 | 2 | 4 | 1 | 0 | 12 | 2 | 55+ | |
| Tornado outbreak sequence of June 14–19, 2023 | 34 | 12 | 2 | 0 | 0 | 93 | 4 | 120 | |
| Tornado outbreak of May 17, 1949 | 33 | 4 | 3 | 1 | 0 | 8+ | 1+ | 0+ | |
| Tornado outbreak sequence of January 21–22, 1957 | 33 | 9 | 1 | 1 | 0 | 16 | 13 | 31 | |
| Tornado outbreak sequence of August 24–31, 1964 | 33 | 9 | 1 | 1 | 0 | 26 | 2 | 12 | |
| Tornado outbreak of February 11, 1965 | 33 | 9 | 3 | 0 | 0 | 15 | 0 | 28 | |
| Tornado outbreak of December 16, 2000 | 33 | 9 | 1 | 1 | 0 | 24 | 12 | 186 | [28] |
| 2010 New Year's Eve tornado outbreak | 33 | 4 | 5 | 0 | 0 | 37 | 9 | 32 | [28] |
| Tornado outbreak of March 29–31, 2022 | 33 | 9 | 3 | 0 | 0 | 90 | 2 | 17 | [28] |
| Great Blue Norther of November 11, 1911 | 32 | 6 | 2 | 1 | 0 | 13+ | 16 | 101+ | |
| Tornado outbreak of May 11, 1947 | 32 | 1 | 4 | 1 | 0 | 6 | 1 | 22 | |
| Tornado outbreak sequence of May 27 – June 2, 1958 | 32 | 11 | 2 | 0 | 0 | 23 | 0 | 3 | |
| Tornado outbreak of April 14–15, 1965 | 32 | 6 | 4 | 0 | 0 | 16 | 1 | 58 | |
| Tornado outbreak sequence of September 20–23, 1965 | 32 | 6 | 4 | 0 | 0 | 26 | 0 | 4 | |
| Tornado outbreak of April 12–13, 1967 | 32 | 16 | 0 | 0 | 0 | 30 | 0 | 9 | |
| Tornado outbreak of January 12, 2023 | 32 | 11 | 2 | 0 | 0 | 44 | 8 | 53 | |
| Tornado outbreak of May 19–22, 2024 | 32 | 6 | 2 | 1 | 0 | 81 | 5 | 69+ | |
| Tornado outbreak and derecho of June 19–22, 2025 | 32 | 6 | 1 | 0 | 1 | 41 | 7 | 2+ | |
| 1881 Minnesota tornado outbreak | 31 | 3 | 1 | 2 | 0 | 6+ | 24 | 123+ | |
| Tornado outbreak of September 29, 1927 | 31 | 8 | 3 | 0 | 0 | 15 | 82+ | 620+ | |
| St. Louis tornado outbreak of February 1959 | 31 | 3 | 3 | 1 | 0 | 17 | 21 | 358 | |
| Tornado outbreak of June 22–24, 1960 | 31 | 8 | 3 | 0 | 0 | 18 | 0 | 10 | |
| Tornado outbreak of March 4, 1964 | 31 | 3 | 3 | 1 | 0 | 8 | 4 | 44 | |
| 1984 Soviet Union tornado outbreak | 31 | 3 | 1 | 2 | 0 | 11 | 403 | 804 | [78] |
| November 1989 tornado outbreak | 31 | 8 | 1 | 1 | 0 | 40 | 30 | 523 | [28] |
| Tornado outbreak of September 21–23, 2006 | 31 | 8 | 1 | 1 | 0 | 48 | 0 | 14+ | [28][79][80] |
| October 2013 North American storm complex | 31 | 3 | 1 | 2 | 0 | 22 | 3 | 17+ | [28] |
| Tornado outbreak and floods of April 28 – May 1, 2017 | 31 | 8 | 1 | 1 | 0 | 75 | 5 | 70 | [28] |
| Tornado outbreak of February 24–25, 1956 | 30 | 10 | 0 | 1 | 0 | 23 | 6 | 47 | |
| Tornado outbreak of February 26–27, 1958 | 30 | 5 | 4 | 0 | 0 | 16 | 13 | 92 | |
| Tornado outbreak of March 26–27, 1950 | 30 | 10 | 2 | 0 | 0 | 16 | 1 | 52 | |
| Tornado outbreak sequence of June 20–23, 1957 | 30 | 5 | 1 | 0 | 1 | 23 | 11 | 105 | |
| Tornado outbreak of May 4–6, 1959 | 30 | 15 | 0 | 0 | 0 | 50 | 0 | 2 | |
| Tornado outbreak of December 10–11, 1967 | 30 | 10 | 2 | 0 | 0 | 22 | 2 | 103 | |
| Tornado outbreak of March 12, 1971 | 30 | 0 | 4 | 1 | 0 | 10 | 1 | 5 | [56] |
| 1978 Bossier City tornado outbreak | 30 | 5 | 2 | 1 | 0 | 11 | 5 | 277 | [28] |
| May 2009 Southern Midwest derecho | 30 | 10 | 2 | 0 | 0 | 39 | 4 | 5+ | [28] |
| Late-May 2010 tornado outbreak | 30 | 10 | 0 | 1 | 0 | 80 | 0 | 0 | [28] |
| Tornado outbreak of December 23–25, 2015 | 30 | 5 | 2 | 1 | 0 | 38 | 13 | 77 | [28] |
| Tornado outbreak of February 23–24, 2016 | 30 | 5 | 4 | 0 | 0 | 61 | 7 | 136 | [28] |
| August 2017 Chinese tornado family | 30 | 0 | 0 | 3 | 0 | 3 | 5 | 58+ | [81] |
| Tornado outbreak sequence of June 20–26, 2023 | 30 | 10 | 2 | 0 | 0 | 114 | 5 | 126 |
See also
- Baron Tornado Index
- List of F5, EF5, and IF5 tornadoes
- Tornado records
- Wind engineering
References
- ↑ NOAA: Fujita Tornado Damage Scale
- ↑ Tornado Damage Scales: Fujita Scale and Enhanced Fujita Scale
- ↑ Schultz, Colin. "Here's How the Enhanced Fujita Scale Works, and This Is What It Looks Like". https://www.smithsonianmag.com/smart-news/heres-how-the-enhanced-fujita-scale-works-and-this-is-what-it-looks-like-78879392/.
- ↑ Brooks, Harold E. (2004-04-01). "On the Relationship of Tornado Path Length and Width to Intensity". Weather and Forecasting 19 (2): 310–319. doi:10.1175/1520-0434(2004)019<0310:OTROTP>2.0.CO;2. Bibcode: 2004WtFor..19..310B. https://zenodo.org/record/1234655.
- ↑ 5.0 5.1 Grazulis, Thomas P. (July 1993). Significant Tornadoes 1680–1991. St. Johnsbury, Vermont: The Tornado Project of Environmental Films. ISBN 978-1-879362-03-1.
- ↑ 6.0 6.1 Edwards, Moller, Purpura (2005). "Basic Spotters' Field Guide". US Department of Commerce, National Weather Service. http://www.nws.noaa.gov/om/brochures/basicspot.pdf.
- ↑ Meaden, Dr. Terence (1985). "A Brief History of TORRO (to 1985)". TORRO. http://www.torro.org.uk/TORRO/about/history.php.
- ↑ Various. "British Weather Extremes Summary". TORRO. http://www.torro.org.uk/TORRO/britwxextremes/summary.php.
- ↑ Edwards, Roger (2006-04-04). "The Online Tornado FAQ". Storm Prediction Center. http://www.spc.noaa.gov/faq/tornado.
- ↑ Center for Severe Weather Research (2006). "Doppler On Wheels". http://cswr.org/dow/DOW.htm.
- ↑ Lyons, Walter A. The Handy Weather Answer Book. Detroit: Visible Ink Press, 1997.
- ↑ Chasing Tornadoes @ National Geographic Magazine
- ↑ Korosec, Marko (2021-06-25). "The most powerful tornado on record hit the Czech Republic, leaving several fatalities and 200+ injured across the Hodonin district". https://www.severe-weather.eu/weather-report/europe-severe-weather-tornado-hodonin-czech-republic-mk/.
- ↑ 14.0 14.1 "F5 and EF5 Tornadoes of the United States - 1950-present (SPC)". Storm Prediction Center. https://www.spc.noaa.gov/faq/tornado/f5torns.html.
- ↑ "Storm Prediction Center WCM Page: Severe Weather Database Files (1950-2019)". Storm Prediction Center. https://www.spc.noaa.gov/wcm/#data.
- ↑ "Canada's Top Ten Weather Stories for 2007". Environment Canada. https://ec.gc.ca/meteo-weather/default.asp?lang=En&n=07580648-1. Retrieved 12 March 2022.
- ↑ 17.0 17.1 17.2 Data from the Storm Prediction Center archives, which are accessible through SvrPlot, free software created and maintained by John Hart, lead forecaster for the SPC.
- ↑ "Enderlin Tornado #1 Upgraded to EF-5" (in en-US). https://mesonet.agron.iastate.edu/wx/afos/p.php?pil=PNSFGF&e=202510061430.
- ↑ The Fujita Scale of Tornado Intensity
- ↑ "Severe Thunderstorm Climatology". http://www.nssl.noaa.gov/hazard/.
- ↑ "Search Tornadoes". http://www.tornadohistoryproject.com/.
- ↑ "Climatological or Past Storm Information and Archived Data." Storm Prediction Center. 2006.
- ↑ "Tornado - Tornado intensity". https://www.britannica.com/science/tornado/Tornado-intensity#ref218368.
- ↑ Murphy, John D. (9 July 2018). "National Weather Service Instruction 10-1605". National Weather Service. pp. A–74–75. https://www.nws.noaa.gov/directives/sym/pd01016005curr.pdf.
- ↑ "Tornado Safe Rooms" (in en-US). https://tornado-strong.org/fact-sheet/choosing-the-right-safe-room-for-you/.
- ↑ LaDue, Jim; Marshall, Tim; Scharfenberg, Kevin (March 2012). "Discriminating EF4 and EF5 Tornado Damage". http://www.norman.noaa.gov/nsww/wp-content/uploads/2012/03/LaDue_NSWW2012.pdf.
- ↑ "Tornadoes". University of Illinois at Urbana–Champaign Department of Atmospheric Sciences. n.d.. http://ww2010.atmos.uiuc.edu/(Gh)/guides/mtr/svr/torn/home.rxml.
- ↑ 28.000 28.001 28.002 28.003 28.004 28.005 28.006 28.007 28.008 28.009 28.010 28.011 28.012 28.013 28.014 28.015 28.016 28.017 28.018 28.019 28.020 28.021 28.022 28.023 28.024 28.025 28.026 28.027 28.028 28.029 28.030 28.031 28.032 28.033 28.034 28.035 28.036 28.037 28.038 28.039 28.040 28.041 28.042 28.043 28.044 28.045 28.046 28.047 28.048 28.049 28.050 28.051 28.052 28.053 28.054 28.055 28.056 28.057 28.058 28.059 28.060 28.061 28.062 28.063 28.064 28.065 28.066 28.067 28.068 28.069 28.070 28.071 28.072 28.073 28.074 28.075 28.076 28.077 28.078 28.079 28.080 28.081 28.082 28.083 28.084 28.085 28.086 28.087 28.088 28.089 28.090 28.091 28.092 28.093 28.094 28.095 28.096 28.097 28.098 28.099 28.100 28.101 28.102 28.103 28.104 28.105 28.106 28.107 28.108 28.109 28.110 28.111 28.112 28.113 28.114 28.115 28.116 28.117 28.118 28.119 28.120 28.121 28.122 28.123 28.124 28.125 28.126 28.127 28.128 28.129 28.130 28.131 28.132 28.133 Grazulis, Thomas P. (2023). Significant Tornadoes 1974–2022. St. Johnsbury, Vermont: The Tornado Project. ISBN 978-1-879362-01-7.
- ↑ Grazulis, Thomas (29 August 2023). "The Outbreaks Section". Tornado Project. http://www.tornadoproject.com/book/outbreaks_section.htm.
- ↑ "On This Day: 2011 Tornado Super Outbreak". Asheville, North Carolina: National Oceanic and Atmospheric Administration. 25 April 2017. https://www.ncei.noaa.gov/news/2011-tornado-super-outbreak.
- ↑ Knox, John A.; Rackley, Jared A.; Black, Alan W.; Gensini, Vittorio A.; Butler, Michael; Dunn, Corey; Gallo, Taylor; Hunter, Melyssa R. et al. (September 2013). "Tornado Debris Characteristics And Trajectories During The 27 April 2011 Super Outbreak As Determined Using Social Media Data". Bulletin of the American Meteorological Society (American Meteorological Society) 94 (9): 1371–1380. doi:10.1175/BAMS-D-12-00036.1. ISSN 1520-0477. Bibcode: 2013BAMS...94.1371K.
- ↑ Additional references for the 2011 Super Outbreak:
- ↑ Hamill, Thomas M.; Schneider, Russell S.; Brooks, Harold E.; Forbes, Gregory S.; Bluestein, Howard B.; Steinberg, Michael; Meléndez, Daniel; Dole, Randall M. (April 2005). "The May 2003 Extended Tornado Outbreak". Bulletin of the American Meteorological Society (American Meteorological Society) 86 (4): 531–542. doi:10.1175/BAMS-86-4-531. Bibcode: 2005BAMS...86..531H. https://journals.ametsoc.org/view/journals/bams/86/4/bams-86-4-531.xml. Retrieved 29 March 2024.
- ↑ 34.0 34.1 34.2 Belles, Jonathan; Wiltgen, Nick (28 April 2018). "5 May Tornado Outbreaks That Had The Biggest Impacts" (News article). Atlanta, United States: The Weather Channel. https://weather.com/storms/severe/news/2018-04-28-severe-weather-tornado-outbreaks-may-impact.
- ↑ Schneider, Russell S.; Schaefer, Joseph T.; Brooks, Harold E. (2004). "Tornado outbreak days: An updated and expanded climatology (1875-2003)". National Oceanic and Atmospheric Administration Publications (The Storm Prediction Center and the National Severe Storms Laboratory) 1 (1). https://api22.meetcarrot.com/publications/schneider/otbrkday.pdf. Retrieved 29 March 2024.
- ↑ "NWS Jackson, MS--November 21-22, 1992 Tornado Outbreak". Jackson, Mississippi: National Oceanic and Atmospheric Administration. https://www.weather.gov/jan/1992_11_21_22_tor.
- ↑ Tungesvick, Kevin; Pytlak, Erik (December 1993). "A case study of the 22 November 1992 Ohio Valley tornado outbreak". Eastern Region Technical Attachment (National Weather Service (U.S.)) (National Oceanic and Atmospheric Administration) 93 (12B). https://repository.library.noaa.gov/view/noaa/6836. Retrieved 29 March 2024.
- ↑ Frosig, Greg (1994). "16 June 1992 Chandler Tornado and Subsequent Derecho Development". St. Cloud State University Publications.
- ↑ "Chandler-Lake Wilson Minnesota F5 Tornado of June 16, 1992". Sioux Falls, South Dakota: National Oceanic and Atmospheric Administration. https://www.weather.gov/fsd/19920616-tornado-chandlerlakewilson.
- ↑ "Super Outbreak - March 21, 1932". National Oceanic and Atmospheric Administration. https://www.weather.gov/bmx/event_03211932.
- ↑ "Southeast U.S. Severe Thunderstorm Climatology and 1932 Tornado Outbreak - ProQuest" (in en). The University of Memphis ProQuest Dissertations Publishing. December 2019. ProQuest 2377258693. https://www.proquest.com/docview/2377258693. Retrieved 29 March 2024.
- ↑ Ostby, Frederick P.; Pearson, Allen D. (February 1974). "The Tornado Season of 1973". Weatherwise (National Severe Storms Forecast Center via Taylor & Francis) 27 (1): 4–9. doi:10.1080/00431672.1974.9931674. ISSN 0043-1672. Bibcode: 1974Weawi..27a...4O. https://www.tandfonline.com/doi/abs/10.1080/00431672.1974.9931674. Retrieved 30 March 2024.
- ↑ Carr, J. A. (March 1952). "A PRELIMINARY REPORT ON THE TORNADOES OF MARCH 21–22, 1952". Monthly Weather Review (WBAN AnalysIs Center & United States Weather Bureau) 80 (3): 50–58. doi:10.1175/1520-0493(1952)080<0050:APROTT>2.0.CO;2. Bibcode: 1952MWRv...80...50C. https://journals.ametsoc.org/view/journals/mwre/80/3/1520-0493_1952_080_0050_aprott_2_0_co_2.xml. Retrieved 30 March 2024.
- ↑ "May 31, 1985 Tornado Outbreak: 35th Anniversary" (Historiography). State College, Pennsylvania: National Oceanic and Atmospheric Administration. 2020. https://www.weather.gov/ctp/TornadoOutbreak_May311985.
- ↑ "The Tornado Outbreak of May 31, 1985". Cleveland, Ohio: National Oceanic and Atmospheric Administration. https://www.weather.gov/cle/event_19850531_85outbreak.
- ↑ Simmons, Kevin M.; Sutter, Daniel (2012). Deadly season: analysis of the 2011 tornado outbreaks. Boston, Mass: American Meteorological Society. ISBN 978-1-878220-25-7.
- ↑ Beebe, Robert (1 February 1961). "Tornadoes During 1960". Weatherwise (Midwest Weather Service via Taylor & Francis) 14 (1): 16–29. doi:10.1080/00431672.1961.9933184. Bibcode: 1961Weawi..14a..16B. https://www.tandfonline.com/doi/abs/10.1080/00431672.1961.9933184. Retrieved 30 March 2024.
- ↑ Quoetone, Elizabeth M.; Andra, David L.; Bunting, William F.; Jones, Debra G. (October 2001). "Impacts of Technology and Situation Awareness on Decision Making: Operational Observations from National Weather Service Warning Forecasters During the Historic May 3 1999 Tornado Outbreak". Proceedings of the Human Factors and Ergonomics Society Annual Meeting (Warning Decision Training Division, National Weather Service, and SA Technologies, Inc via Sage Publishing) 45 (4): 419–424. doi:10.1177/154193120104500433. https://journals.sagepub.com/doi/abs/10.1177/154193120104500433. Retrieved 29 March 2024.
- ↑ "Enigma Tornado Outbreak of February 19, 1884". Birmingham, Alabama: National Oceanic and Atmospheric Administration. https://www.weather.gov/bmx/event_02191884.
- ↑ "Tornado Outbreak of April 12, 2020". Birmingham, Alabama: National Oceanic and Atmospheric Administration. https://www.weather.gov/bmx/event_04122020.
- ↑ "South Carolina Tornado Outbreak 4/13/2020". Columbia, South Carolina: Government of South Carolina. 20 April 2020. https://www.dnr.sc.gov/climate/sco/Publications/tornadooutbreak.pdf.
- ↑ Hill, Nick (11 April 2022). "Remembering the 2020 Easter Tornado Outbreak". WDEF. https://www.wdef.com/remembering-the-2020-easter-tornado-outbreak/.
- ↑ "U.S. Billion-Dollar Weather and Climate Disasters (1980-2023)". National Oceanic and Atmospheric Administration. July 2023. p. 2. https://www.ncei.noaa.gov/access/billions/events.pdf.
- ↑ "The May 22nd, 2004 Tornado Outbreak". National Oceanic and Atmospheric Administration, U.S. Dept of Commerce. http://www.weather.gov/gid/May22Tornadoes2004.
- ↑ "Tornado Outbreak March 12, 2006" (Historiography). Pleasant Hill, Missouri: National Oceanic and Atmospheric Administration. https://www.weather.gov/eax/mar122006.
- ↑ 56.00 56.01 56.02 56.03 56.04 56.05 56.06 56.07 56.08 56.09 56.10 56.11 56.12 56.13 56.14 Cite error: Invalid
<ref>tag; no text was provided for refs namedGrazulisOld - ↑ "Top Ten Deadliest Oklahoma Tornadoes (1882-Present)". National Weather Service in Norman, Oklahoma. https://www.weather.gov/oun/tornadodata-ok-deadliest.
- ↑ "The April 12, 1945 Tornado Outbreak". National Oceanic and Atmospheric Administration. 26 April 2021. https://storymaps.arcgis.com/stories/ce31f44c04ec40739c6ddc97921ef573.
- ↑ "Tornado Outbreak - May 27-28, 2019". Wilmington, Ohio: National Oceanic and Atmospheric Administration. https://www.weather.gov/iln/20190527.
- ↑ Gensini, Vittorio A.; Gold, David; Allen, John T.; Barrett, Bradford S. (28 August 2019). "Extended U.S. Tornado Outbreak During Late May 2019: A Forecast of Opportunity". Geophysical Research Letters (Northern Illinois University, International Business Machines Corporation, Central Michigan University, and the United States Naval Academy via the American Geophysical Union) 46 (16): 10150–10158. doi:10.1029/2019GL084470. Bibcode: 2019GeoRL..4610150G.
- ↑ "The Violent Tornado Outbreak of December 10-11, 2021". Paducah, Kentucky: National Oceanic and Atmospheric Administration. 2022. https://www.weather.gov/pah/December-10th-11th-2021-Tornado.
- ↑ "NWS Little Rock, AR - The Tornado Outbreak of January 21-22, 1999". Little Rock, Arkansas: National Oceanic and Atmospheric Administration. https://www.weather.gov/lzk/outbreak012199.htm.
- ↑ "March 1, 1997, Arkansas tornado outbreak". Silver Spring, Maryland: United States Department of Commerce. http://www.nws.noaa.gov/om/assessments/pdfs/ark61.pdf. Retrieved 13 February 2014.
- ↑ "NWS Little Rock, AR - Tornado Outbreak (March 1, 1997)". Little Rock, Arkansas: National Oceanic and Atmospheric Administration. https://www.weather.gov/lzk/tor030197.htm.
- ↑ "Noticias de Córdoba hoy | Noticias Córdoba". http://www.diaadia.com.ar/content/ya-son-11-los-muertos-por-el-tornado-en-misiones.
- ↑ "Una pesadilla que se vive en el recuerdo: El tornado que azotó San Pedro y que cambió la historia de la tierra colorada y la tiñó de sangre - MisionesOnline". https://misionesonline.net/2020/09/05/tornado-san-pedro-misiones-4/.
- ↑ "Cristina en Misiones". https://www.lapoliticaonline.com/nota/nota-60010/.
- ↑ "At least 7 people killed in Brazil storms - CNN.com". CNN. 9 September 2009. https://edition.cnn.com/2009/WORLD/americas/09/09/brazil.mudslide/index.html.
- ↑ "grazulis May 6-10 OIS scoring". https://x.com/sigtor2019/status/1790050762174636255?s=46&t=qS0n16XhYMOv-kF6m_Tg1g.
- ↑ "Tornado Outbreak of April 2, 2006" (Historiography). Memphis, Tennessee: National Oceanic and Atmospheric Administration. https://www.weather.gov/meg/tornado_outbreak_060402.
- ↑ "NOVEMBER 23 2004 TORNADO OUTBREAK". Lake Charles, Louisiana: National Oceanic and Atmospheric Administration. https://www.weather.gov/lch/e112304.
- ↑ "Severe Weather Outbreak - November 23-24, 2004". Birmingham, Alabama: National Oceanic and Atmospheric Administration. https://www.weather.gov/bmx/event_1123242004.
- ↑ Daniel McCarthy; Joseph Schaefer. 2004 year in tornadoes: What a year it was! (Report). Storm Prediction Center. https://www.spc.noaa.gov/publications/mccarthy/tors2004.pdf. Retrieved January 25, 2023.
- ↑ "The Tornado Outbreak across the North Florida Panhandle in association with Hurricane Ivan". National Weather Service office in Tallahassee, Florida. American Meteorological Society. 2005. http://www.srh.noaa.gov/images/tae/pdf/research/AMS_RadarConf.pdf.
- ↑ "The Intense Mississippi Tornadoes of March 24, 2023" (ArcGIS StoryMap). Jackson, Mississippi & Memphis, Tennessee: National Oceanic and Atmospheric Administration. 2023. https://storymaps.arcgis.com/stories/498732c9fda04e6c85118c8e96e47de7.
- ↑ "Extended Severe Event of March 24-27, 2023" (Historiography). Birmingham, Alabama: National Oceanic and Atmospheric Administration. https://www.weather.gov/bmx/event_03242023.
- ↑ F. C. Pate (United States Weather Bureau) (October 1946). "The Tornado at Montgomery, Alabama, February 12, 1945". Bulletin of the American Meteorological Society (American Meteorological Society) 27 (8): 462–464. https://www.jstor.org/stable/26257954. Retrieved 27 May 2023.
- ↑ "Ивановский смерч 9 июня 1984 года: торнадо по-советски" (in ru). Русская семерка. 2017-01-31. https://russian7.ru/post/ivanovskiy-smerch-9-iyunya-1984-goda-tornado-p/.
- ↑ "Tornado Outbreak September 22nd, 2006". St. Louis, Missouri, United States: National Oceanic and Atmospheric Administration. https://www.weather.gov/media/lsx/Events/09_22_2006.pdf.
- ↑ "Tornado and Severe Weather - September 22nd, 2006". Springfield, Missouri: National Oceanic and Atmospheric Administration. https://www.weather.gov/sgf/events_2006sep22.
- ↑ "佛山顺德气象局". https://www.shundemos.com/zixunInfo.aspx$id=136158.htm.
- Edwards, Roger; J. G. LaDue; J. T. Ferree; K. Scharfenberg; C. Maier; W. L. Coulbourne (2013). "Tornado Intensity Estimation: Past, Present, and Future". Bull. Amer. Meteor. Soc. 94 (5): 641–53. doi:10.1175/BAMS-D-11-00006.1. Bibcode: 2013BAMS...94..641E.
- Agee, Ernest; S. Childs (2014). "Adjustments in Tornado Counts, F-Scale Intensity, and Path Width for Assessing Significant Tornado Destruction". J. Appl. Meteorol. Climatol. 53 (6): 1494–505. doi:10.1175/JAMC-D-13-0235.1. Bibcode: 2014JApMC..53.1494A.
Further reading
- Feuerstein, Bernold; P. Groenemeijer; E. Dirksen; M. Hubrig; A.M. Holzer; N. Dotzek (Jun 2011). "Towards an improved wind speed scale and damage description adapted for Central Europe". Atmos. Res. 100 (4): 547–64. doi:10.1016/j.atmosres.2010.12.026. Bibcode: 2011AtmRe.100..547F.
 |  |
