Earth:Weather buoy

Weather buoys are instruments which collect weather and ocean data within the world's oceans, as well as aid during emergency response to chemical spills, legal proceedings, and engineering design. Moored buoys have been in use since 1951, while drifting buoys have been used since 1979. Moored buoys are connected with the ocean bottom using either chains, nylon, or buoyant polypropylene. With the decline of the weather ship, they have taken a more primary role in measuring conditions over the open seas since the 1970s. During the 1980s and 1990s, a network of buoys in the central and eastern tropical Pacific Ocean helped study the El Niño-Southern Oscillation. Moored weather buoys range from 1.5–12 metres (5–40 ft) in diameter, while drifting buoys are smaller, with diameters of 30–40 centimetres (12–16 in). Drifting buoys are the dominant form of weather buoy in sheer number, with 1250 located worldwide. Wind data from buoys has smaller error than that from ships. There are differences in the values of sea surface temperature measurements between the two platforms as well, relating to the depth of the measurement and whether or not the water is heated by the ship which measures the quantity.
History

The first known proposal for surface weather observations at sea occurred in connection with aviation in August 1927, when Grover Loening stated that "weather stations along the ocean coupled with the development of the seaplane to have an equally long range, would result in regular ocean flights within ten years."[1] Starting in 1939, United States Coast Guard vessels were being used as weather ships to protect transatlantic air commerce.[2]
During World War II The German Navy deployed weather buoys (Wetterfunkgerät See — WFS) at fifteen fixed positions in the North Atlantic and Barents Sea. They were launched from U-boats into a maximum depth of ocean of 1000 fathoms (1,800 metres), limited by the length of the anchor cable. Overall height of the body was 10.5 metres (of which most was submerged), surmounted by a mast and extendible aerial of 9 metres. Data (air and water temperature, atmospheric pressure and relative humidity) were encoded and transmitted four times a day. When the batteries (high voltage dry-cells for the valves, and nickel-iron for other power and to raise and lower the aerial mast) were exhausted, after about eight to ten weeks, the unit self-destructed.[3][4]
The Navy Oceanographic Meteorological Automatic Device (NOMAD) buoy's 6-metre (20 ft) hull was originally designed in the 1940s for the United States Navy’s offshore data collection program. The United States Navy tested marine automatic weather stations for hurricane conditions between 1956 and 1958, though radio transmission range and battery life was limited.[5] Between 1951 and 1970, a total of 21 NOMAD buoys were built and deployed at sea.[6] Since the 1970s, weather buoy use has superseded the role of weather ships, as they are cheaper to operate and maintain.[7] The earliest reported use of drifting buoys was to study the behavior of ocean currents within the Sargasso Sea in 1972 and 1973.[8] Drifting buoys have been used increasingly since 1979, and as of 2005, 1250 drifting buoys roamed the Earth's oceans.[9]
Between 1985 and 1994, an extensive array of moored and drifting buoys was deployed across the equatorial Pacific Ocean to monitor and help predict the El Niño phenomenon.[10] Hurricane Katrina capsized a 10 m (33 ft) buoy for the first time in the history of the National Data Buoy Center (NDBC) on August 28, 2005.[11] On June 13, 2006, drifting buoy 26028 ended its long-term data collection of sea surface temperature after transmitting for 10 years, 4 months, and 16 days, which is the longest known data collection time for any drifting buoy.[12] The first weather buoy in the Southern Ocean was deployed by the Integrated Marine Observing System (IMOS) on March 17, 2010.[13]
Instrumentation
Weather buoys, like other types of weather stations, measure parameters such as air temperature above the ocean surface, wind speed (steady and gusting), barometric pressure, and wind direction. Since they lie in oceans and lakes, they also measure water temperature, wave height, and dominant wave period.[14] Raw data is processed and can be logged on board the buoy and then transmitted via radio, cellular, or satellite communications to meteorological centers for use in weather forecasting and climate study. Both moored buoys and drifting buoys (drifting in the open ocean currents) are used. Fixed buoys measure the water temperature at a depth of 3 metres (9.8 ft).[15] Many different drifting buoys exist around the world that vary in design and the location of reliable temperature sensors varies. These measurements are beamed to satellites for automated and immediate data distribution.[15] Other than their use as a source of meteorological data, their data is used within research programs, emergency response to chemical spills, legal proceedings, and engineering design.[14] Moored weather buoys can also act as a navigational aid, like other types of buoys.
Types

Weather buoys range in diameter from 1.5–12 metres (5–40 ft). Those that are placed in shallow waters are smaller in size and moored using only chains, while those in deeper waters use a combination of chains, nylon, and buoyant polypropylene.[14] Since they do not have direct navigational significance, moored weather buoys are classed as special marks under the IALA scheme, are coloured yellow, and display a yellow flashing light at night.
Discus buoys are round and moored in deep ocean locations, with a diameter of 10–12 metres (33–39 ft).[16][17] The aluminum 3-metre (10 ft) buoy is a very rugged meteorological ocean platform that has long term survivability. The expected service life of the 3-metre (10 ft) platform is in excess of 20 years and properly maintained, these buoys have not been retired due to corrosion. The NOMAD is a unique moored aluminum environmental monitoring buoy designed for deployments in extreme conditions near the coast and across the Great Lakes.[16] NOMADs moored off the Atlantic Canadian coast commonly experience winter storms with maximum wave heights approaching 20 metres (66 ft) into the Gulf of Maine.


Drifting buoys are smaller than their moored counterparts, measuring 30–40 centimetres (12–16 in) in diameter. They are made of plastic or fiberglass, and tend to be either bi-colored, with white on one half and another color on the other half of the float, or solidly black or blue. It measures a smaller subset of meteorological variables when compared to its moored counterpart, with a barometer measuring pressure in a tube on its top. They have a thermistor (metallic thermometer) on its base, and an underwater drogue, or sea anchor, located 15 metres (49 ft) below the ocean surface connected with the buoy by a long, thin tether.[18]
Deployment and maintenance

A large network of coastal buoys near the United States is maintained by the National Data Buoy Center,[19] with deployment and maintenance performed by the United States Coast Guard.[20] For South Africa, the South African Weather Service deploys and retrieves their own buoys, while the Meteorological Service of New Zealand performs the same task for their country.[21] Environment Canada operates and deploys buoys for their country.[22] The Met Office in Great Britain deploys drifting buoys across both the northern and southern Atlantic oceans.[23]
Comparison to data from ships
Wind reports from moored buoys have smaller error than those from ships. Complicating the comparison of the two measurements are that NOMAD buoys report winds at a height of 5 metres (16 ft), while ships report winds from a height of 20–40 metres (66–131 ft).[24] Sea surface temperature measured in the intake port of large ships have a warm bias of around 0.6 °C (1 °F) due to the heat of the engine room.[25] Since 2000 sea-surface temperatures have increasingly been measured by thermometers on buoys; the apparent cooler temperatures led to an underestimation of global warming since 2000.[26] Fixed buoys measure the water temperature at a depth of 3 metres (10 ft).[15]
Gallery
-
 12-Meter Discus Buoy
 -
 12-Meter Discus Buoy
 -
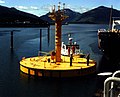
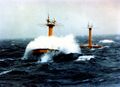
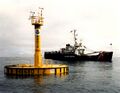
 10 m discus buoy
 -
 10 m discus buoy
 -
 10 m discus buoy


References
- ↑ George Lee Dowd Jr. (August 1927). "The First Plane to Germany". Popular Science (Popular Science Publishing Company, Inc.) 111 (2): 121. https://books.google.com/books?id=ICoDAAAAMBAJ&pg=PA121. Retrieved 2011-01-18.
- ↑ Malcolm Francis Willoughby (1980-06-01). The U.S. Coast Guard in World War II. pp. 127–130. ISBN 978-0-405-13081-6. https://books.google.com/books?id=T5A9LCujs08C&pg=PA129. Retrieved 2011-01-18.
- ↑ Dege, Wilhelm (2003). War north of 80 : the last German Arctic weather station of World War II.. Calgary, Alta.: Arctic Institute of North America. pp. 300–301. ISBN 9780870817687.
- ↑ Selinger, Franz (1985). "Deutsche automatische Wetterstationen in der Arktis 1942-1945". Polarforschung (Bremerhaven) (55): 55–67.
- ↑ J. A. Shirley (May 1959). "Marine Automatic Weather Stations". Weather Bureau Topics 18 (5): 83. ftp://ftp.library.noaa.gov/docs.lib/htdocs/rescue/wb_topicsandpersonnel/1959.pdf. Retrieved 2017-08-10.
- ↑ G. L. Timpe; N. Van de Voorde (October 1995). "NOMAD buoys: An overview of forty years of use". 'Challenges of Our Changing Global Environment'. Conference Proceedings. OCEANS '95 MTS/IEEE. 1. pp. 309–315. doi:10.1109/OCEANS.1995.526788. ISBN 0-933957-14-9.
- ↑ National Research Council (U.S.). Ocean Science Committee, National Research Council (U.S.). Study Panel on Ocean Atmosphere Interaction (1974). The role of the ocean in predicting climate: a report of workshops conducted by Study Panel on Ocean Atmosphere Interaction under the auspices of the Ocean Science Committee of the Ocean Affairs Board, Commission on Natural Resources, National Research Council. National Academies. p. 40. https://books.google.com/books?id=2zQrAAAAYAAJ&pg=PA40. Retrieved 2011-01-18.
- ↑ Elwyn E. Wilson (July 1973). "Scientists Discover Western Atlantic Currents Are Highly Variable". Mariners Weather Log (National Oceanic and Atmospheric Administration) 17 (4).
- ↑ National Aeronautics and Space Administration (2009-04-15). "Ocean Motion and Surface Currents". http://oceanmotion.org/html/gatheringdata/buoysanddrifers.htm.
- ↑ K. A. Browning; Robert J. Gurney (1999). Global energy and water cycles. Cambridge University Press. p. 62. ISBN 978-0-521-56057-3. https://books.google.com/books?id=DO5K1NK_ZewC&pg=PA62. Retrieved 2011-01-09.
- ↑ Hurricanes: Science and Society (2010). "Weather Buoys". University of Rhode Island. http://www.hurricanescience.org/science/observation/ships/weatherbuoys/.
- ↑ Collecte Localisation Satellites (June 2010). "ARGOS Guinness Book". p. 5. http://www.argos-system.org/documents/publications/newsletter/anl_70.pdf.
- ↑ Integrated Marine Observing System (May 2010). "IMOS deploys the world's first weather buoy in the remote Southern Ocean". Marine Matters (Department of Innovation, Industry, Science and Research) (8): 1. http://imos.org.au/fileadmin/user_upload/shared/IMOS%20General/documents/newsletters/IMOS_newsletter_8_May_2010.pdf. Retrieved 2016-08-20.
- ↑ 14.0 14.1 14.2 National Data Buoy Center (2008-02-04). "Moored Buoy Program". National Oceanic and Atmospheric Administration. http://www.ndbc.noaa.gov/mooredbuoy.shtml.
- ↑ 15.0 15.1 15.2 Vittorio Barale (2010). Oceanography from Space: Revisited. Springer. pp. 237–238. ISBN 978-90-481-8680-8. https://books.google.com/books?id=hH2NkL_318wC&pg=PA263. Retrieved 2011-01-09.
- ↑ 16.0 16.1 Jeff Markell (2003). The Sailor's Weather Guide. Sheridan House, Inc.. p. 13. ISBN 978-1-57409-158-8. https://books.google.com/books?id=qXxIieLNl2gC&pg=PA13. Retrieved 2011-01-27.
- ↑ "Watching the Oceans: A Report From General Dynamics". Naval Institute Proceedings (Annapolis, Maryland: United States Naval Institute) 93 (1): 28–29. January 1967. ISSN 0041-798X. https://books.google.com/books?id=nmU7AAAAIAAJ&q=watching+the+oceans+a+report+from+general+dynamics+monster+buoy&pg=RA2-PA28. Retrieved 16 June 2020.
- ↑ "What's a Drifter?". The Global Drifter Program. 2010-06-08. http://www.aoml.noaa.gov/phod/dac/gdp_drifter.php.
- ↑ Lance F. Bosart, William A. Sprigg, National Research Council (1998). The meteorological buoy and coastal marine automated network for the United States. National Academies Press. p. 11. ISBN 978-0-309-06088-2. https://archive.org/details/meteorologicalbu0000unse/page/11.
- ↑ Department of Homeland Security (2009-06-02). "Department of Homeland Security Weather Programs". Office of the Federal Coordinator for Meteorology. p. 2. http://www.ofcm.gov/fp-fy09/pdf/3Sec3f-DHS.pdf.
- ↑ Data Buoy Cooperation Panel (2009). "Buoy Recover Techniques". Joint WMO-IOC Technical Commission for Oceanography and Marine Meteorology in situ Observing Platform Support Centre. pp. 1–4. http://www.jcommops.org/dbcp/doc/buoyRecoveries/Buoy%20Recovery%20Techniques.pdf.
- ↑ Environment Canada (2010-12-30). "Marine Weather Observations". Government of Canada. http://ec.gc.ca/meteo-weather/default.asp?lang=En&n=656F7CE5-1.
- ↑ Met Office (2011). "Marine Observations". https://www.metoffice.gov.uk/weather/learn-about/how-forecasts-are-made/observations/marine-observations.
- ↑ Bridget R. Thomas; Elizabeth C. Kent; Val R. Swail (2005). "Methods to Homogenize Wind Speeds From Ships and Buoys". International Journal of Climatology (John Wiley & Sons, Ltd.) 25 (7): 979–995. doi:10.1002/joc.1176. Bibcode: 2005IJCli..25..979T. http://www.homogenisation.org/files/private/WG1/Bibliography/Method_Description/Climate/thomas_etal_2004.pdf. Retrieved 2018-03-01.
- ↑ William J. Emery; Richard E. Thomson (2001). Data analysis methods in physical oceanography. Gulf Professional Publishing. pp. 24–25. ISBN 978-0-444-50757-0. https://books.google.com/books?id=A6ew-bJDIDIC&pg=PA24. Retrieved 2011-01-09.
- ↑ Michael Marshall (2010-11-16). "Ships and buoys made global warming look slower". New Scientist. https://www.newscientist.com/article/dn19772-ships-and-buoys-made-global-warming-look-slower-.html. Retrieved 2011-01-29.
External links
- USA National Data Buoy Center
- Ship locations and weather buoys
- Data Buoy Cooperation Panel (DBCP)
- Hurricane Rita and the Buoys
 |  |
