Equivalence test
Equivalence tests are a variety of hypothesis tests used to draw statistical inferences from observed data. In these tests, the null hypothesis is defined as an effect large enough to be deemed interesting, specified by an equivalence bound. The alternative hypothesis is any effect that is less extreme than said equivalence bound. The observed data are statistically compared against the equivalence bounds. If the statistical test indicates the observed data is surprising, assuming that true effects are at least as extreme as the equivalence bounds, a Neyman-Pearson approach to statistical inferences can be used to reject effect sizes larger than the equivalence bounds with a pre-specified Type 1 error rate.
Equivalence testing originates from the field of clinical trials.[1] One application, known as a non-inferiority trial, is used to show that a new drug that is cheaper than available alternatives works as well as an existing drug. In essence, equivalence tests consist of calculating a confidence interval around an observed effect size and rejecting effects more extreme than the equivalence bound when the confidence interval does not overlap with the equivalence bound. In two-sided tests, both upper and lower equivalence bounds are specified. In non-inferiority trials, where the goal is to test the hypothesis that a new treatment is not worse than existing treatments, only a lower equivalence bound is specified.

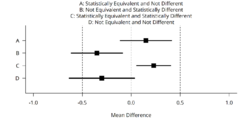
Equivalence tests can be performed in addition to null-hypothesis significance tests.[2][3][4][5] This might prevent common misinterpretations of p-values larger than the alpha level as support for the absence of a true effect. Furthermore, equivalence tests can identify effects that are statistically significant but practically insignificant, whenever effects are statistically different from zero, but also statistically smaller than any effect size deemed worthwhile (see the first figure).[6] Equivalence tests were originally used in areas such as pharmaceutics, frequently in bioequivalence trials. However, these tests can be applied to any instance where the research question asks whether the means of two sets of scores are practically or theoretically equivalent. Equivalence tests have recently been introduced in evaluation of measurement devices,[7][8] artificial intelligence,[9] exercise physiology and sports science,[10] political science,[11] psychology,[6][12] and economics.[13] Several tests exist for equivalence analyses; however, more recently the two-one-sided t-tests (TOST) procedure has been garnering considerable attention. As outlined below, this approach is an adaptation of the widely known t-test.
TOST procedure
A very simple equivalence testing approach is the ‘two one-sided t-tests’ (TOST) procedure.[14] In the TOST procedure an upper (ΔU) and lower (–ΔL) equivalence bound is specified based on the smallest effect size of interest (e.g., a positive or negative difference of d = 0.3). Two composite null hypotheses are tested: H01: Δ ≤ –ΔL and H02: Δ ≥ ΔU. When both these one-sided tests can be statistically rejected, we can conclude that –ΔL < Δ < ΔU, or that the observed effect falls within the equivalence bounds and is statistically smaller than any effect deemed worthwhile and considered practically equivalent".[6] Alternatives to the TOST procedure have been developed as well.[15] A recent modification to TOST makes the approach feasible in cases of repeated measures and assessing multiple variables.[16]
Comparison between t-test and equivalence test
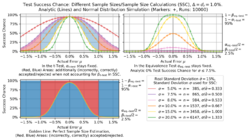
The equivalence test can be induced from the t-test.[7] Consider a t-test at the significance level αt-test with a power of 1-βt-test for a relevant effect size dr. If Δ = dr as well as αequiv.-test = βt-test and βequiv.-test = αt-test coincide, i.e. the error types (type I and type II) are interchanged between the t-test and the equivalence test, then the t-test will obtain the same results as the equivalence test. To achieve this for the t-test, either the sample size calculation needs to be carried out correctly, or the t-test significance level αt-test needs to be adjusted, referred to as the so-called revised t-test.[7] Both approaches have difficulties in practice since sample size planning relies on unverifiable assumptions of the standard deviation, and the revised t-test yields numerical problems.[7] Preserving the test behavior, those limitations can be removed by using an equivalence test.
The figure below allows a visual comparison of the equivalence test and the t-test when the sample size calculation is affected by differences between the a priori standard deviation and the sample's standard deviation , which is a common problem. Using an equivalence test instead of a t-test additionally ensures that αequiv.-test is bounded, which the t-test does not do in case that with the type II error growing arbitrarily large. On the other hand, having results in the t-test being stricter than the dr specified in the planning, which may randomly penalize the sample source (e.g., a device manufacturer). This makes the equivalence test safer to use.

See also
- Bootstrap (statistics)-based testing
Literature
The papers below are good introductions to equivalence testing.
- Westlake, W. J. (1976). "Symmetrical confidence intervals for bioequivalence trials". Biometrics 32 (4): 741–744. doi:10.2307/2529265.
- Berger, Roger L.; Hsu, Jason C. (1996). "Bioequivalence trials, intersection-union tests and equivalence confidence sets". Statistical Science 11 (4): 283–319. doi:10.1214/ss/1032280304.
- Walker, Esteban; Nowacki, Amy S. (2011). "Understanding Equivalence and Noninferiority Testing". Journal of General Internal Medicine 26 (2): 192–196. doi:10.1007/s11606-010-1513-8. PMID 20857339.
- Rainey, Carlisle (2014). "Arguing for a Negligible Effect". American Journal of Political Science 58 (4): 1083–1091. doi:10.1111/ajps.12102. https://www.carlislerainey.com/papers/nme.pdf. Retrieved 2025-06-01.
- Lakens, Daniël (2017). "Equivalence Tests: A Practical Primer for t Tests, Correlations, and Meta-Analyses". Social Psychological and Personality Science 8 (4): 355–362. doi:10.1177/1948550617697177.
- Lakens, Daniël; Isager, P. M.; Scheel, A. M. (2018). "Equivalence Testing for Psychological Research: A Tutorial". Advances in Methods and Practices in Psychological Science 1 (2): 259–269. doi:10.1177/2515245918770963.
- Fitzgerald, Jack (2025). "The Need for Equivalence Testing in Economics". https://osf.io/preprints/metaarxiv/d7sqr.
- An applied introduction to equivalence testing appears in Section 4.2 of Vincent Arel-Bundock’s open-access book Model to Meaning.[17]
References
- ↑ Snapinn, Steven M. (2000). "Noninferiority trials" (in en). Current Controlled Trials in Cardiovascular Medicine 1 (1): 19–21. doi:10.1186/CVM-1-1-019. PMID 11714400.
- ↑ Rogers, James L.; Howard, Kenneth I.; Vessey, John T. (1993). "Using significance tests to evaluate equivalence between two experimental groups.". Psychological Bulletin 113 (3): 553–565. doi:10.1037/0033-2909.113.3.553. PMID 8316613.
- ↑ Statistics applied to clinical trials (4th ed.). Springer. 2009. ISBN 978-1402095221.
- ↑ Piaggio, Gilda; Elbourne, Diana R.; Altman, Douglas G.; Pocock, Stuart J.; Evans, Stephen J. W.; CONSORT Group, for the (8 March 2006). "Reporting of Noninferiority and Equivalence Randomized Trials". JAMA 295 (10): 1152–60. doi:10.1001/jama.295.10.1152. PMID 16522836. https://researchonline.lshtm.ac.uk/id/eprint/12069/1/Reporting%20of%20Noninferiority%20and%20Equivalence%20Randomized%20Trials.pdf.
- ↑ Piantadosi, Steven (28 August 2017). Clinical trials : a methodologic perspective (Third ed.). John Wiley & Sons. p. 8.6.2. ISBN 978-1-118-95920-6.
- ↑ 6.0 6.1 6.2 Lakens, Daniël (2017-05-05). "Equivalence Tests" (in en). Social Psychological and Personality Science 8 (4): 355–362. doi:10.1177/1948550617697177. PMID 28736600.
- ↑ 7.0 7.1 7.2 7.3 7.4 Siebert, Michael; Ellenberger, David (2019-04-10). "Validation of automatic passenger counting: introducing the t-test-induced equivalence test" (in en). Transportation 47 (6): 3031–3045. doi:10.1007/s11116-019-09991-9. ISSN 0049-4488.
- ↑ Schnellbach, Teresa (2022). Hydraulic Data Analysis Using Python. doi:10.26083/tuprints-00022026. http://tuprints.ulb.tu-darmstadt.de/22026/.
- ↑ Jahn, Nico; Siebert, Michael (2022). "Engineering the Neural Automatic Passenger Counter". Engineering Applications of Artificial Intelligence 114. doi:10.1016/j.engappai.2022.105148. https://www.sciencedirect.com/science/article/pii/S0952197622002652.
- ↑ Mazzolari, Raffaele; Porcelli, Simone; Bishop, David J.; Lakens, Daniël (March 2022). "Myths and methodologies: The use of equivalence and non-inferiority tests for interventional studies in exercise physiology and sport science". Experimental Physiology 107 (3): 201–212. doi:10.1113/EP090171. PMID 35041233.
- ↑ Rainey, Carlisle (2014). "Arguing for a Negligible Effect". American Journal of Political Science 58 (4): 1083–1091. doi:10.1111/ajps.12102. https://www.carlislerainey.com/papers/nme.pdf. Retrieved 2025-06-01.
- ↑ Lakens, Daniël; Isager, P. M.; Scheel, A. M. (2018). "Equivalence Testing for Psychological Research: A Tutorial". Advances in Methods and Practices in Psychological Science 1 (2): 259–269. doi:10.1177/2515245918770963.
- ↑ Fitzgerald, Jack (2023). "The Need for Equivalence Testing in Economics". https://osf.io/preprints/metaarxiv/d7sqr.
- ↑ Schuirmann, Donald J. (1987-12-01). "A comparison of the Two One-Sided Tests Procedure and the Power Approach for assessing the equivalence of average bioavailability" (in en). Journal of Pharmacokinetics and Biopharmaceutics 15 (6): 657–680. doi:10.1007/BF01068419. ISSN 0090-466X. PMID 3450848. https://zenodo.org/record/1232484.
- ↑ Wellek, Stefan (2010). Testing statistical hypotheses of equivalence and noninferiority. Chapman and Hall/CRC. ISBN 978-1439808184.
- ↑ Rose, Evangeline M.; Mathew, Thomas; Coss, Derek A.; Lohr, Bernard; Omland, Kevin E. (2018). "A new statistical method to test equivalence: an application in male and female eastern bluebird song". Animal Behaviour 145: 77–85. doi:10.1016/j.anbehav.2018.09.004. ISSN 0003-3472.
- ↑ Arel-Bundock, Vincent (2025). "Model to Meaning: How to Interpret Statistical Models" (in en). marginaleffects.com. https://marginaleffects.com/chapters/hypothesis.html#sec-hypothesis_equivalence.
 |
