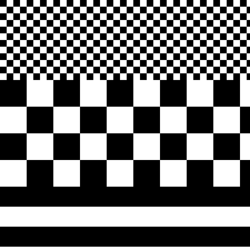
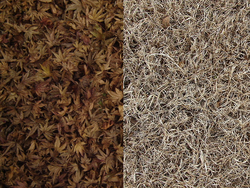
Image texture


An image texture is a set of metrics calculated in image processing designed to quantify the perceived texture of an image. Image texture gives us information about the spatial arrangement of color or intensities in an image or selected region of an image.[1]
Image textures can be artificially created or found in natural scenes captured in an image. Image textures are one way that can be used to help in segmentation or classification of images. For more accurate segmentation the most useful features are spatial frequency and an average grey level.[2] To analyze an image texture in computer graphics, there are two ways to approach the issue: Structured Approach and Statistical Approach.
Structured Approach
A structured approach sees an image texture as a set of primitive texels in some regular or repeated pattern. This works well when analyzing artificial textures.
To obtain a structured description a characterization of the spatial relationship of the texels is gathered by using Voronoi tessellation of the texels.
Statistical Approach
A statistical approach sees an image texture as a quantitative measure of the arrangement of intensities in a region. In general this approach is easier to compute and is more widely used, since natural textures are made of patterns of irregular subelements.
Edge Detection
The use of edge detection is to determine the number of edge pixels in a specified region, helps determine a characteristic of texture complexity. After edges have been found the direction of the edges can also be applied as a characteristic of texture and can be useful in determining patterns in the texture. These directions can be represented as an average or in a histogram.
Consider a region with N pixels. the gradient-based edge detector is applied to this region by producing two outputs for each pixel p: the gradient magnitude Mag(p) and the gradient direction Dir(p). The edgeness per unit area can be defined by for some threshold T.
To include orientation with edgeness histograms for both gradient magnitude and gradient direction can be used. Hmag(R) denotes the normalized histogram of gradient magnitudes of region R, and Hdir(R) denotes the normalized histogram of gradient orientations of region R. Both are normalized according to the size NR Then is a quantitative texture description of region R.
Co-occurrence Matrices
The co-occurrence matrix captures numerical features of a texture using spatial relations of similar gray tones.[3] Numerical features computed from the co-occurrence matrix can be used to represent, compare, and classify textures. The following are a subset of standard features derivable from a normalized co-occurrence matrix:
where is the th entry in a gray-tone spatial dependence matrix, and Ng is the number of distinct gray-levels in the quantized image.
One negative aspect of the co-occurrence matrix is that the extracted features do not necessarily correspond to visual perception. It is used in dentistry for the objective evaluation of lesions [DOI: 10.1155/2020/8831161], treatment efficacy [DOI: 10.3390/ma13163614; DOI: 10.11607/jomi.5686; DOI: 10.3390/ma13173854; DOI: 10.3390/ma13132935] and bone reconstruction during healing [DOI: 10.5114/aoms.2013.33557; DOI: 10.1259/dmfr/22185098; EID: 2-s2.0-81455161223; DOI: 10.3390/ma13163649].
Laws Texture Energy Measures
Another approach is to use local masks to detect various types of texture features. Laws[4] originally used four vectors representing texture features to create sixteen 2D masks from the outer products of the pairs of vectors. The four vectors and relevant features were as follows:
 L5  =  [ +1  +4  6  +4  +1 ]  (Level)
 E5  =  [ -1  -2  0  +2  +1 ]  (Edge)
 S5  =  [ -1   0  2   0  -1 ]  (Spot)
 R5  =  [ +1  -4  6  -4  +1 ]  (Ripple)
To these 4, a fifth is sometimes added:[5]
W5 = [ -1 +2 0 -2 +1 ] (Wave)
From Laws' 4 vectors, 16 5x5 "energy maps" are then filtered down to 9 in order to remove certain symmetric pairs. For instance, L5E5 measures vertical edge content and E5L5 measures horizontal edge content. The average of these two measures is the "edginess" of the content. The resulting 9 maps used by Laws are as follows:[6]
L5E5/E5L5
L5R5/R5L5
E5S5/S5E5
S5S5
R5R5
L5S5/S5L5
E5E5
E5R5/R5E5
S5R5/R5S5
Running each of these nine maps over an image to create a new image of the value of the origin ([2,2]) results in 9 "energy maps," or conceptually an image with each pixel associated with a vector of 9 texture attributes.
Autocorrelation and Power Spectrum
The autocorrelation function of an image can be used to detect repetitive patterns of textures.
Texture Segmentation
The use of image texture can be used as a description for regions into segments. There are two main types of segmentation based on image texture, region based and boundary based. Though image texture is not a perfect measure for segmentation it is used along with other measures, such as color, that helps solve segmenting in image.
Region Based
Attempts to group or cluster pixels based on texture properties.
Boundary Based
Attempts to group or cluster pixels based on edges between pixels that come from different texture properties.
See also
Further reading
A detailed description of texture analysis in biomedical images can be found in Depeursinge et al. (2017).[7] Texture analysis is used to examine radiological images in oral surgery [DOI: 10.3390/ma13132935; DOI: 10.3390/ma13163649] and periodontology [DOI: 10.3390/ma13163614; DOI: 10.17219/acem/104524].
References
- ↑ Linda G. Shapiro and George C. Stockman, Computer Vision, Upper Saddle River: Prentice–Hall, 2001
- ↑ Trambitskiy K.V.; Anding K.; Polte G.A.; Garten D.; Musalimov V.M. (2015). "Out-of-focus region segmentation of 2D surface images with the use of texture features.". Scientific and Technical Journal of Information Technologies, Mechanics and Optics 15 (5): 796–802. doi:10.17586/2226-1494-2015-15-5-796-802.
- ↑ Robert M. Haralick, K. Shanmugam, and Its'hak Dinstein, "Textural Features for Image Classification", IEEE Transactions on Systems, Man, and Cybernetics, 1973, SMC-3 (6): 610–621
- ↑ K. Laws "Textured Image Segmentation", Ph.D. Dissertation, University of Southern California, January 1980
- ↑ A. Meyer-Bäse, "Pattern Recognition for Medical Imaging", Academic Press, 2004.
- ↑ CSE576: Computer Vision: Chapter 7. University of Washington. 2000. pp. 9–10. http://courses.cs.washington.edu/courses/cse576/book/ch7.pdf.
- ↑ Depeursinge, A.; Al-Kadi, Omar S.; Mitchell, J. Ross (2017-10-01). Biomedical Texture Analysis: Fundamentals, Tools and Challenges. Elsevier. ISBN 9780128121337. https://www.elsevier.com/books/title/author/9780128121337.
 |
