Ionosonde


An ionosonde, or chirpsounder, is a special radar for the examination of the ionosphere. The basic ionosonde technology was invented in 1925 by Gregory Breit and Merle A. Tuve[1] and further developed in the late 1920s by a number of prominent physicists, including Edward Victor Appleton. The term ionosphere and hence, the etymology of its derivatives, was proposed by Robert Watson-Watt.
Components
An ionosonde consists of:
- A high frequency (HF) radio transmitter, automatically tunable over a wide range. Typically the frequency coverage is 0.5–23 MHz or 1–40 MHz, though normally sweeps are confined to approximately 1.6–12 MHz.
- A tracking HF receiver which can automatically track the frequency of the transmitter.
- An antenna with a suitable radiation pattern, which transmits well vertically upwards and is efficient over the whole frequency range used.
- Digital control and data analysis circuits.
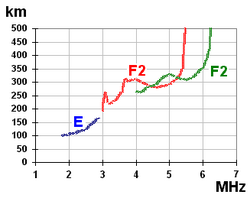
The transmitter sweeps all or part of the HF frequency range, transmitting short pulses. These pulses are reflected at various layers of the ionosphere, at heights of 100–400 km (60 to 250 miles), and their echos are received by the receiver and analyzed by the control system. The result is displayed in the form of an ionogram, a graph of reflection height (actually time between transmission and reception of pulse) versus carrier frequency.
An ionosonde is used for finding the optimum operation frequencies for broadcasts or two-way communications in the high frequency range.
Ionogram
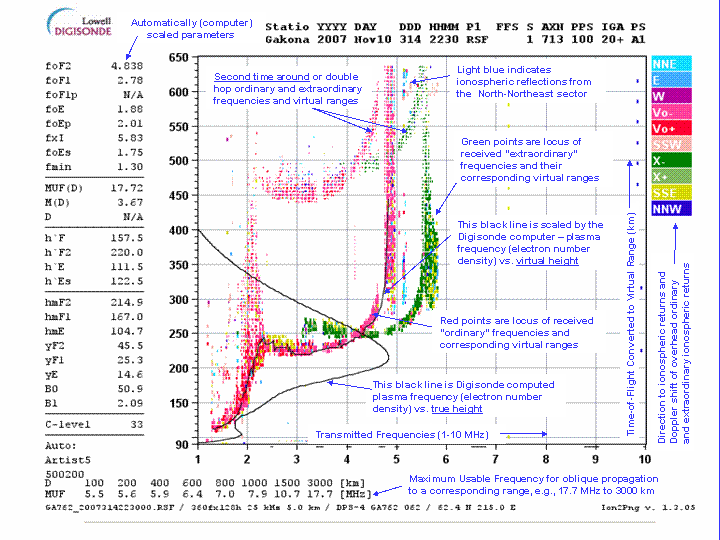
An ionogram is a display of the data produced by an ionosonde; technically speaking one may call the data used to make the display as the ionogram but often this is simply implied. It is a graph of the virtual height of the ionosphere plotted against frequency. Ionograms are often converted into electron density profiles. Data from ionograms may be used to measure changes in the Earth's ionosphere due to space weather events.
Note that in the ionogram above the legend can be more clearly understood as having "Vx-" and "Vx+" to replace respectively "X-" and "X+". These refer to the vertical reflection of the eXtraordinary kind. "Vo-" and "Vo+" refer to the Ordinary reflection. An Ordinarily reflected wave is the one that behaves as though there were no geomagnetic field.
ARTIST is the software program used to "scale" (deduce or calculate) the characteristic parameter values shown in the table on the left. The version shown here is "5", which is the latest as of March 2022. Ion2Png is the software program used to create the ionogram image.
Chirp transmitter
A chirp transmitter is a shortwave radio transmitter that sweeps the HF radio spectrum on a regular schedule. If one is monitoring a specific frequency, then a chirp is heard (in CW or SSB mode) when the signal passes through. In addition to their use in probing ionospheric properties,[2] these transmitters are also used for over-the-horizon radar systems.[3]
An analysis of existing transmitters has been done using SDR technology.[4] For better identification of chirp transmitters the following notation is used: <repetition rate (s)>:<chirp offset (s)>, where the repetition rate is the time between two sweeps in seconds and the chirp offset is the time of the first sweep from 0 MHz after a full hour in seconds. If the initial frequency is greater than 0 MHz, the offset time can be linearly extrapolated to 0 MHz.[2]
See also
- Duga radar
- Ionosonde Juliusruh
- Radio propagation beacon
- Total electron content
- Trevor Wadley#Ionosonde
References
- ↑ F.C. Judd, G2BCX (1987). Radio Wave Propagation (HF Bands). London: Heinemann. pp. 12–20, 27–37. ISBN 978-0-434-90926-1.
- ↑ 2.0 2.1 Peter Martinez, G3PLX: Chirps and HF Propagation http://jcoppens.com/radio/prop/g3plx/index.en.php
- ↑ Radar Handbook (M. Skolnik) http://www.helitavia.com/skolnik/Skolnik_chapter_24.pdf
- ↑ Pieter-Tjerk de Boer, PA3FWM: Chirp Signals analyzed using SDR http://websdr.ewi.utwente.nl:8901/chirps/
Further reading
- Davies, Kenneth (1990). Ionospheric Radio. IEE Electromagnetic Waves Series #31. London, UK: Peter Peregrinus Ltd/The Institution of Electrical Engineers. pp. 93–111. ISBN 978-0-86341-186-1.
- Gwyn Williams, G4FKH (May 2009). "Interpreting Digital Ionograms". RadCom 85 (5): 44–46.
- Breit, G.; Tuve, M.A. (1926). "A Test of the Existence of the Conducting Layer". Physical Review 28 (3): 554–575. doi:10.1103/PhysRev.28.554. Bibcode: 1926PhRv...28..554B.
- Appleton, E. V. (January 1931). "The Timing of Wireless Echoes, the use of television and picture transmission". Wireless World (14): 43–44.
- http://www.ngdc.noaa.gov/stp/IONO/ionogram.html National Geophysical Data Center
- Gwyn Williams, G4FKH (May 2009). "Interpreting Digital Ionograms". RadCom 85 (5): 44–46.
External links
- http://www.ngdc.noaa.gov/stp/iono/ionogram.html : NOAA Ionosonde portal to information and data services
- http://www.ngdc.noaa.gov/stp/IONO/Dynasonde/ : NOAA Dynasonde: Real-time Ionospheric Explorer by advanced and prototype analysis methods.
- http://aintel.bi.ehu.es/chirps-data/chirps.html
- http://ulcar.uml.edu/digisonde.html : Lowell Center for Atmospheric Research, MA, USA
- http://ulcar.uml.edu/stationlist.html : Ionosonde (partial) station list by location
- http://car.uml.edu/common/DIDBFastStationList : DIDBase Fast Station list
- http://www.iono.noa.gr : National Observatoy of Athens, Greece
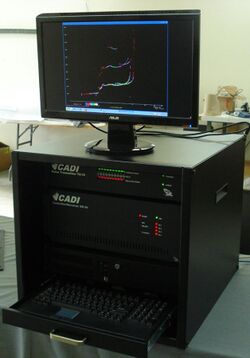
- http://www.sil.sk.ca/content/cadi : Canadian Advanced Digital Ionosonde (CADI)
 |

