Line detection
In image processing, line detection is an algorithm that takes a collection of n edge points and finds all the lines on which these edge points lie.[1] The most popular line detectors are the Hough transform and convolution-based techniques.[2]
Hough transform
The Hough transform[3] can be used to detect lines and the output is a parametric description of the lines in an image, for example ρ = r cos(θ) + c sin(θ).[1] If there is a line in a row and column based image space, it can be defined ρ, the distance from the origin to the line along a perpendicular to the line, and θ, the angle of the perpendicularjection from the origin to the line measured in degrees clockwise from the positive row axis. Therefore, a line in the image corresponds to a point in the Hough space.[4] The Hough space for lines has therefore these two dimensions θ and ρ, and a line is represented by a single point corresponding to a unique set of these parameters. The Hough transform can then be implemented by choosing a set of values of ρ and θ to use. For each pixel (r, c) in the image, compute r cos(θ) + c sin(θ) for each values of θ, and place the result in the appropriate position in the (ρ, θ) array. At the end, the values of (ρ, θ) with the highest values in the array will correspond to strongest lines in the image
Convolution-based technique
In a convolution-based technique, the line detector operator consists of a convolution masks tuned to detect the presence of lines of a particular width n and a θ orientation. Here are the four convolution masks to detect horizontal, vertical, oblique (+45 degrees), and oblique (−45 degrees) lines in an image.
a) Horizontal mask(R1)
| −1 | −1 | −1 |
| 2 | 2 | 2 |
| −1 | −1 | −1 |
(b) Vertical (R3)
| −1 | 2 | −1 |
| −1 | 2 | −1 |
| −1 | 2 | −1 |
(C) Oblique (+45 degrees)(R2)
| −1 | −1 | 2 |
| −1 | 2 | −1 |
| 2 | −1 | −1 |
(d) Oblique (−45 degrees)(R4)
| 2 | −1 | −1 |
| −1 | 2 | −1 |
| −1 | −1 | 2 |
In practice, masks are run over the image and the responses are combined given by the following equation:
R(x, y) = max(|R1 (x, y)|, |R2 (x, y)|, |R3 (x, y)|, |R4 (x, y)|)
If R(x, y) > T, then discontinuity
As can be seen below, if mask is overlay on the image (horizontal line), multiply the coincident values, and sum all these results, the output will be the (convolved image). For example, (−1)(0)+(−1)(0)+(−1)(0) + (2)(1) +(2)(1)+(2)(1) + (−1)(0)+(−1)(0)+(−1)(0) = 6 pixels on the second row, second column in the (convolved image) starting from the upper left corner of the horizontal lines.[1] page 82
Example
| Horizontal line | convolved image | |||||||||||
| 0 | 0 | 0 | 0 | - | - | - | - | |||||
| 1 | 1 | 1 | 1 | = | - | 6 | 6 | - | ||||
| Mask | * | 0 | 0 | 0 | 0 | - | - | - | - | |||
| −1 | −1 | −1 | ||||||||||
| 2 | 2 | 2 | ||||||||||
| −1 | −1 | −1 | ||||||||||
| * | Vertical line | convolved image | ||||||||||
| 0 | 0 | 1 | 0 | - | - | - | - | |||||
| 0 | 0 | 1 | 0 | = | - | 0 | 0 | - | ||||
| 0 | 0 | 1 | 0 | - | - | - | - | |||||
These masks above are tuned for light lines against a dark background, and would give a big negative response to dark lines against a light background.[5]
Code example
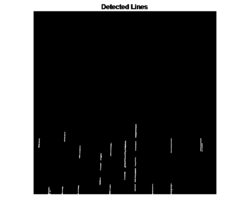
The code was used to detect only the vertical lines in an image using Matlab and the result is below. The original image is the one on the top and the result is below it. As can be seen on the picture on the right, only the vertical lines were detected
clear all
clc
% this MATLAB program will only detect vertical lines in an image
building = imread('building.jpg'); % This will upload the image building
tol = 5; % define a tolerance in the angle to account for noise or edge
        % that may look vertical but when the angle is computed
        % it may not appear to be
[~, angle] = imgradient(building);
out = (angle >= 180 - tol | angle <= -180 + tol);
%this part will filter the line
out_filter = bwareaopen(out, 50);
figure, imshow(building), title('Original Image');
figure, imshow(out_filter), title('Detected Lines');
See also
References
- ↑ 1.0 1.1 1.2 Umbaugh, Scott E. (2011). Digital image processing and analysis : human and computer vision applications with CVIPtools (2nd ed.). Boca Raton, FL: CRC Press. ISBN 9781439802052. OCLC 491888664.
- ↑ "Hough transform - MATLAB hough". http://www.mathworks.com/help/images/ref/hough.html.
- ↑ "Line Detection by Hough transformation". http://web.ipac.caltech.edu/staff/fmasci/home/astro_refs/HoughTrans_lines_09.pdf.
- ↑ Li, Fei‐Fei (10 October 2011). "Finding lines: from detection to model fitting". Stanford Vision Lab. http://vision.stanford.edu/teaching/cs231a_autumn1112/lecture/lecture4_edges_lines_cs231a_marked.pdf.
- ↑ 5.0 5.1 "Line Detection". https://homepages.inf.ed.ac.uk/rbf/HIPR2/linedet.htm.
 |


