Ionosonde
An ionosonde, or chirpsounder, is a special radar for the examination of the ionosphere. The basic ionosonde technology was invented in 1925 by Gregory Breit and Merle A. Tuve[1] and further developed in the late 1920s by a number of prominent physicists, including Edward Victor Appleton. The term ionosphere and hence, the etymology of its derivatives, was proposed by Robert Watson-Watt.
Components
An ionosonde consists of:
- A high frequency (HF) radio transmitter, automatically tunable over a wide range. Typically the frequency coverage is 0.5–23 MHz or 1–40 MHz, though normally sweeps are confined to approximately 1.6–12 MHz.
- A tracking HF receiver which can automatically track the frequency of the transmitter.
- An antenna with a suitable radiation pattern, which transmits well vertically upwards and is efficient over the whole frequency range used.
- Digital control and data analysis circuits.
The transmitter sweeps all or part of the HF frequency range, transmitting short pulses. These pulses are reflected at various layers of the ionosphere, at heights of 100–400 km (62–249 mi), and their echos are received by the receiver and analyzed by the control system. The result is displayed in the form of an ionogram, a graph of reflection height (actually time between transmission and reception of pulse) versus carrier frequency.
An ionosonde is used for finding the optimum operation frequencies for broadcasts or two-way communications in the high frequency range.
Ionogram

An ionogram is a display of the data produced by an ionosonde; technically speaking one may call the data used to make the display as the ionogram but often this is simply implied. It is a graph of the virtual height of the ionosphere plotted against frequency. Ionograms are often converted into electron density profiles. Data from ionograms may be used to measure changes in the Earth's ionosphere due to space weather events.
Note that in the ionogram above the legend can be more clearly understood as having "Vx-" and "Vx+" to replace respectively "X-" and "X+". These refer to the vertical reflection of the eXtraordinary kind. "Vo-" and "Vo+" refer to the Ordinary reflection. An Ordinarily reflected wave is the one that behaves as though there were no geomagnetic field.
ARTIST is the software program used to "scale" (deduce or calculate) the characteristic parameter values shown in the table on the left. The version shown here is "5", which is the latest as of March 2022. Ion2Png is the software program used to create the ionogram image.
Chirp transmitter
A chirp transmitter is a shortwave radio transmitter that sweeps the HF radio spectrum on a regular schedule. If one is monitoring a specific frequency, then a chirp is heard (in CW or SSB mode) when the signal passes through. In addition to their use in probing ionospheric properties,[2] these transmitters are also used for over-the-horizon radar systems.[3]
An analysis of existing transmitters has been done using SDR technology.[4] For better identification of chirp transmitters the following notation is used: <repetition rate (s)>:<chirp offset (s)>, where the repetition rate is the time between two sweeps in seconds and the chirp offset is the time of the first sweep from 0 MHz after a full hour in seconds. If the initial frequency is greater than 0 MHz, the offset time can be linearly extrapolated to 0 MHz.[2]
List of ionosonde sites
| Station | Country | Lat (°) | Lon (°) | URSI code | Earliest data |
|---|---|---|---|---|---|
| ALMATY | Kazakhstan | 43.1800 | 76.9500 | AA343
|
2025-12-11 |
| ALPENA | United States of America | 45.0700 | -83.5600 | AL945
|
2014-04-11 |
| ASCENSION ISLAND | Tuvalu | -7.9500 | -14.4000 | AS00Q
|
1997-03-22 |
| ATHENS | Greece | 38.0000 | 23.5000 | AT138
|
2002-01-15 |
| AUSTIN | United States of America | 30.4000 | -97.7000 | AU930
|
1999-08-23 |
| AWASE | Japan | 26.3200 | 127.8400 | AW426
|
2023-09-08 |
| BAHIA BLANCA | Argentina | 38.7000 | 62.3000 | BBJ3R
|
2016-10-07 |
| BELEM | Tuvalu | 1.4300 | -48.4400 | BLJ03
|
2017-11-07 |
| BOA VISTA | Tuvalu | 2.8000 | -60.7000 | BVJ03
|
2002-10-05 |
| BRISBANE | Australia | -27.0600 | 153.0600 | BR52P
|
2015-03-17 |
| CACHOEIRA PAULISTA | Fiji | -22.7000 | -45.0000 | CAJ2M
|
2000-07-14 |
| CAMPO GRANDE | Fiji | -20.5000 | -55.0000 | CGK21
|
2002-09-17 |
| CANBERRA | Australia | -35.3200 | 149.0000 | CB53N
|
2015-03-17 |
| COCOS_ISLAND | Indian Ocean Ter. | -12.1800 | 96.8300 | CS31K
|
2015-03-17 |
| DARWIN | Australia | -12.4500 | 130.9500 | DW41K
|
2015-03-17 |
| DOURBES | Belgium | 50.1000 | 4.6000 | DB049
|
2001-01-01 |
| EARECKSON | United States of America | 52.7300 | -174.0800 | EA653
|
2018-08-17 |
| EGLIN AFB | United States of America | 30.5000 | -86.5000 | EG931
|
1999-12-31 |
| EIELSON | Russia | 64.6600 | -147.0700 | EI764
|
2006-01-01 |
| EL ARENOSILLO | United States of America | 37.1000 | -6.7000 | EA036
|
2000-04-17 |
| FAIRFORD | United States of America | 51.7000 | -1.5000 | FF051
|
2000-03-25 |
| GAKONA | Russia | 62.3800 | -145.0000 | GA762
|
1998-10-03 |
| GIBILMANNA | Italy | 37.9000 | 14.0000 | GM037
|
2009-04-27 |
| GRAHAMSTOWN | South Africa | -33.3000 | 26.5000 | GR13L
|
1996-04-12 |
| HERMANUS | South Africa | -34.4200 | 19.2200 | HE13N
|
2008-07-04 |
| HOBART | Australia | -42.9200 | 147.3200 | HO54K
|
2015-03-17 |
| I-CHEON | South Korea | 37.1400 | 127.5400 | IC437
|
2010-06-06 |
| IDAHO NATIONAL LAB | United States of America | 43.8100 | -112.6800 | IF843
|
2013-02-19 |
| JEJU | South Korea | 33.4300 | 126.3000 | JJ433
|
2009-01-05 |
| JICAMARCA | Fiji | -12.0000 | -76.8000 | JI91J
|
1993-07-20 |
| JULIUSRUH | Germany | 54.6000 | 13.4000 | JR055
|
2001-01-01 |
| LAJES TERCEIRA ISLAND | United States of America | 38.7700 | -27.0900 | LAA38
|
2024-06-11 |
| LEARMONTH | Australia | -21.8000 | 114.1000 | LM42B
|
1999-12-31 |
| LOUISVALE | South Africa | -28.5000 | 21.2000 | LV12P
|
2000-08-17 |
| LUALUALEI | Marshall Is. | 21.4300 | -158.1500 | LL721
|
2015-11-25 |
| MALINDI | Kenya | -3.1000 | 40.7000 | ML10L
|
2025-08-18 |
| MILLSTONE HILL | United States of America | 42.6000 | -71.5000 | MHJ45
|
1992-03-20 |
| NICOSIA | Cyprus | 35.0300 | 33.1600 | NI135
|
2008-09-17 |
| NIUE | Fiji | -19.0700 | -169.9300 | ND61R
|
2015-03-17 |
| PERTH | Australia | -32.0000 | 116.1300 | PE43K
|
2015-03-17 |
| POKER FLAT | Russia | 65.1300 | -147.4500 | PF765
|
2020-05-07 |
| PRUHONICE | Czechia | 50.0000 | 14.6000 | PQ052
|
2004-01-20 |
| PT ARGUELLO | United States of America | 34.8000 | -120.5000 | PA836
|
1998-05-07 |
| ROME | Italy | 41.8000 | 12.5000 | RM041
|
2004-11-25 |
| ROME | Italy | 41.9000 | 12.5000 | RO041
|
1997-06-07 |
| ROQUETES | Spain | 40.8000 | 0.5000 | EB040
|
1988-06-06 |
| SAN VITO | Italy | 40.6000 | 17.8000 | VT139
|
2000-08-02 |
| SAOLUIS | Tuvalu | -2.6000 | -44.2000 | SAA0K
|
1997-01-19 |
| SOPRON | Hungary | 47.6300 | 16.7200 | SO148
|
2018-06-25 |
| THULE | Russia | 76.5400 | -68.4400 | THJ76
|
2019-08-17 |
| TOWNSVILLE | Australia | -19.6300 | 146.8500 | TV51R
|
2015-03-17 |
| TROLL | Antarctica | -72.0100 | 2.5300 | TR0P2
|
2025-02-07 |
| TROMSO | Norway | 69.6000 | 19.2000 | TR169
|
1993-07-01 |
| WAKE | U.S. Minor Outlying Is. | 19.2900 | 166.6500 | WA619
|
2019-09-09 |
| AHMEDABAD | India | 23.0000 | 72.5000 | AH223
|
2012-06-05 |
| AL DHAFRA AFB | United Arab Emirates | 24.2400 | 54.5800 | DH224
|
2022-03-06 |
| ANYANG | South Korea | 37.3900 | 126.9500 | AN438
|
1998-05-01 |
| BEIJING | China | 40.3000 | 116.2000 | BP440
|
2010-10-07 |
| BERMUDA | United States of America | 32.4000 | -64.7000 | BJJ32
|
2000-01-01 |
| BOULDER | United States of America | 40.0000 | -105.3000 | BC840
|
1999-08-22 |
| BUNDOORA | Australia | -37.7000 | 145.0500 | BV53Q
|
2002-01-15 |
| CACHIMBO | Tuvalu | -9.5000 | -54.8000 | CXM9B
|
2002-09-28 |
| CAMDEN | Australia | -34.0500 | 150.6700 | CN53L
|
2015-03-17 |
| CHERRY | United States of America | 32.9000 | -106.4100 | CH833
|
2014-01-15 |
| CHILTON | United States of America | 51.5000 | -0.6000 | RL052
|
1996-12-16 |
| CHUNG-LI | Taiwan | 25.0000 | 121.2000 | CL424
|
1996-02-21 |
| COLLEGE AK | Russia | 64.9000 | -148.0000 | CO764
|
1999-12-31 |
| COLORADO_SPRINGS | United States of America | 39.0000 | -104.8800 | CS839
|
2008-12-22 |
| DYESS AFB | United States of America | 32.4000 | -99.8000 | DS932
|
1999-12-31 |
| EISCAT TROMSO | Norway | 69.5800 | 19.2200 | TR170
|
2017-04-05 |
| ELEKTROUGLI | Russia | 55.7600 | 38.2800 | MO156
|
2015-03-17 |
| FORTALEZA | Tuvalu | -3.9000 | -38.4000 | FZA0M
|
2001-03-22 |
| GADANKI | India | 13.4600 | 79.1700 | GA313
|
2015-04-16 |
| GOOSE BAY | United States of America | 53.3000 | -60.3000 | GSJ53
|
1995-04-18 |
| GUAM | Guam | 13.6200 | 144.8600 | GU513
|
2009-01-01 |
| HAINAN | China | 19.4000 | 109.0000 | HA419
|
2002-03-24 |
| HANSCOM AFB | United States of America | 42.5000 | -71.3000 | HAJ43
|
1997-03-22 |
| IDAHO NATIONAL LAB | United States of America | 43.8100 | -112.6800 | AC843
|
2012-01-25 |
| ILORIN | Nigeria | 8.5000 | 4.5000 | IL008
|
2010-03-26 |
| IRKUTSK | Russia | 52.4000 | 104.3000 | IR352
|
2002-11-30 |
| JANG BOGO | Antarctica | -74.6200 | 164.2400 | JB57N
|
2017-02-16 |
| KALININGRAD | Poland | 54.3600 | 20.1200 | KL154
|
2015-03-17 |
| KENT IS | United States of America | 38.9600 | -76.2800 | KI939
|
2018-07-11 |
| KHABAROVSK | Russia | 47.5200 | 134.7700 | KB547
|
2016-01-12 |
| KING SALMON | Russia | 58.4000 | -156.4000 | KS759
|
1999-12-31 |
| KIRTLAND | United States of America | 35.0000 | -106.5300 | KR835
|
2014-01-02 |
| KIRUNA SWEDEN | Sweden | 67.8600 | 20.4300 | KI167
|
2018-01-30 |
| KOKUBUNJI | Japan | 35.7000 | 139.5000 | TO535
|
2001-10-30 |
| KWAJALEIN | Marshall Is. | 9.0000 | 167.2000 | KJ609
|
1999-11-17 |
| LAVERTON | Australia | -28.3000 | 122.8000 | LA42Q
|
2008-03-04 |
| MADIMBO | South Africa | -22.3900 | 30.8800 | MU12K
|
2000-01-01 |
| MAGADAN | Russia | 60.0900 | 150.9300 | MA560
|
2015-03-17 |
| MELROSE | United States of America | 29.7100 | -82.0000 | ME929
|
2014-07-16 |
| MISAWA | Japan | 40.7100 | 141.3800 | MI540
|
2023-10-23 |
| MOHE | China | 52.0000 | 122.5200 | MH453
|
2013-08-27 |
| MOSCOW | Russia | 55.4900 | 37.2900 | MA155
|
2015-03-17 |
| MOSCOW | Russia | 55.4700 | 37.3000 | MO155
|
2008-10-26 |
| MULTAN | Pakistan | 33.0300 | 72.0100 | MU230
|
2009-03-01 |
| MUNYO | United States of America | 33.5600 | -106.6500 | MU834
|
2014-01-14 |
| NARSSARSSUAQ | Russia | 61.2000 | -45.4000 | NQJ61
|
2000-03-25 |
| NORD GREENLAND | Russia | 81.4000 | -17.5000 | NDA81
|
2006-08-08 |
| NORILSK | Russia | 69.2000 | 88.0000 | NO369
|
2002-12-06 |
| NOVOSIBIRSK | Russia | 55.0200 | 82.2100 | NV355
|
2018-09-01 |
| OKINAWA | Japan | 26.6800 | 128.1500 | OK426
|
2001-12-31 |
| OLSZTYN | Poland | 53.8000 | 20.5000 | OL246
|
2014-05-02 |
| OSAN AB | South Korea | 37.1000 | 127.0000 | SN437
|
1999-12-31 |
| PETROPAVLOVSK | Russia | 52.9700 | 158.2400 | PK553
|
2015-11-22 |
| PORT STANLEY | New Zealand | -51.6000 | -57.9000 | PSJ5J
|
1996-02-27 |
| PUERTO RICO | Tuvalu | 18.1100 | -66.2500 | SJJ18
|
2014-03-14 |
| RAMEY | Tuvalu | 18.5000 | -67.1000 | PRJ18
|
1999-06-09 |
| ROSTOV | Russia | 47.2400 | 39.6300 | RV149
|
2015-03-17 |
| SALEKHARD | Russia | 66.5100 | 66.6600 | SH266
|
2015-03-17 |
| SANTA MARIA | Fiji | -29.7300 | -53.7100 | SMK29
|
2017-04-13 |
| SANYA | China | 18.3400 | 109.4200 | SA418
|
2013-08-17 |
| SONDRESTROM | Russia | 66.9800 | -50.9400 | SMJ67
|
1989-10-27 |
| SQUIRT | United States of America | 32.4200 | -106.2900 | SQ832
|
2014-01-08 |
| ST. PETERSBURG | Russia | 60.0000 | 30.7000 | LD160
|
2018-02-28 |
| THULE/QAANAAQ | Russia | 77.5000 | -69.2000 | THJ77
|
1987-01-01 |
| TRIVANDRUM | India | 8.5400 | 76.8700 | TM308
|
2009-02-03 |
| TUCUMAN | Fiji | -26.9000 | -65.4000 | TUJ2O
|
2002-11-11 |
| TUCUMAN AIS-INGV | Fiji | -26.9000 | -65.4000 | TNJ20
|
2014-03-01 |
| TUNGUSKA | Russia | 61.5800 | 90.0200 | TZ362
|
2015-03-17 |
| WALLOPS IS | United States of America | 37.9000 | -75.5000 | WP937
|
1999-08-22 |
| WALLOPS ISLAND | United States of America | 37.9400 | -75.5800 | WI937
|
2014-01-09 |
| WARSAW | Poland | 52.2000 | 21.1000 | MZ152
|
2012-04-19 |
| WUHAN | China | 30.5000 | 114.4000 | WU430
|
2002-01-27 |
| XINXIANG CHINA | China | 35.3000 | 113.9200 | XI434
|
2006-06-20 |
| YAKUTSK | Russia | 62.0000 | 129.6000 | YA462
|
2002-11-29 |
| ZHIGANSK | Russia | 66.8000 | 123.4000 | ZH466
|
2003-11-12 |
| ZHONG SHAN | Antarctica | -69.4000 | 76.4000 | ZS36R
|
2005-01-01 |
| <graph>
{ // // ATTENTION: This code is maintained at https://www.mediawiki.org/wiki/Template:Graph:Street_map_with_marks // Please do not modify it anywhere else, as it may get copied and override your changes. // Suggestions can be made at https://www.mediawiki.org/wiki/Template_talk:Graph:Street_map_with_marks // // Template translation is in https://commons.wikimedia.org/wiki/Data:Original/Template:Graphs.tab // "version": 2, "width":800, "height": 400, "padding": 0, "signals":[ // These signals allow us to quickly move the map within the image, e.g. to leave space for the legend {"name":"legendWidth", "init": {"expr": "0"} }, {"name":"legendHeight", "init": {"expr": "height"} },
{"name":"imgWidth", "init": {"expr": "width-legendWidth"} },
{"name":"imgHeight", "init": {"expr": "height"} },
{"name":"imgXC", "init": {"expr": "imgWidth/2"} },
{"name":"imgYC", "init": {"expr": "imgHeight/2"} },
{"name":"imgTileSize", "init": {"expr": "256"} },
{"name":"imgLat", "init": {"expr": "20"} },
{"name":"imgLon", "init": {"expr": "10"} },
{"name":"imgZoom", "init": {"expr": "1"} },
{"name":"picWidth", "init": {"expr": "180"} },
{"name":"picHeight", "init": {"expr": "picWidth/2"} },
{"name":"picXC", "init": {"expr": "imgWidth-(picWidth/2)"} },
{"name":"picYC", "init": {"expr": "imgHeight-(picHeight/2)"} },
{"name":"showMiniMap", "init": {"expr": "0"} }
],
"data": [
{
"name": "data",
// Otherwise use the first unnamed argument for source values "values": [ { "lat": 20,
"lon": 10,
"img": "wikirawupload:https://handwiki.org/wiki/images/thumb/1/10/Mapscaleline.svg/120px-Mapscaleline.svg.png",
"width": 50,
"height": 8,
"offsetX": 363,
"offsetY": 190,
"textAlign": "right",
"textDx": 22,
"textDy": -2,
"textColor": "grey",
"textFont": "Tahoma",
"textFontSize": 9,
"text": "5000km" }
, { "lat": 43.18000, "lon": 76.95000, "img": "wikirawupload:https://handwiki.org/wiki/images/thumb/0/0c/Red_pog.svg/10px-Red_pog.svg.png", "height": 10, "width": 10, "text": "", "textAngle": 0, "textAlign": "right", "textBaseline": "middle", "textDx": -7, "textDy": 1, "textFontSize": 12, "textColor": "#AA1205"
}
, { "lat": 0.1, "lon": 0.1, "img": "wikirawupload:https://handwiki.org/wiki/images/thumb/0/0c/Red_pog.svg/10px-Red_pog.svg.png", "height": 10, "width": 10, "text": "", "textAngle": 0, "textAlign": "right", "textBaseline": "middle", "textDx": -7, "textDy": 1, "textFontSize": 12, "textColor": "#AA1205"
} , { "lat": 45.07000, "lon": -83.56000, "img": "wikirawupload:https://handwiki.org/wiki/images/thumb/0/0c/Red_pog.svg/10px-Red_pog.svg.png", "height": 10, "width": 10, "text": "", "textAngle": 0, "textAlign": "right", "textBaseline": "middle", "textDx": -7, "textDy": 1, "textFontSize": 12, "textColor": "#AA1205"
} , { "lat": -7.95000, "lon": -14.40000, "img": "wikirawupload:https://handwiki.org/wiki/images/thumb/0/0c/Red_pog.svg/10px-Red_pog.svg.png", "height": 10, "width": 10, "text": "", "textAngle": 0, "textAlign": "right", "textBaseline": "middle", "textDx": -7, "textDy": 1, "textFontSize": 12, "textColor": "#AA1205"
} , { "lat": 38.00000, "lon": 23.50000, "img": "wikirawupload:https://handwiki.org/wiki/images/thumb/0/0c/Red_pog.svg/10px-Red_pog.svg.png", "height": 10, "width": 10, "text": "", "textAngle": 0, "textAlign": "right", "textBaseline": "middle", "textDx": -7, "textDy": 1, "textFontSize": 12, "textColor": "#AA1205"
} , { "lat": 30.40000, "lon": -97.70000, "img": "wikirawupload:https://handwiki.org/wiki/images/thumb/0/0c/Red_pog.svg/10px-Red_pog.svg.png", "height": 10, "width": 10, "text": "", "textAngle": 0, "textAlign": "right", "textBaseline": "middle", "textDx": -7, "textDy": 1, "textFontSize": 12, "textColor": "#AA1205"
} , { "lat": 26.32000, "lon": 127.84000, "img": "wikirawupload:https://handwiki.org/wiki/images/thumb/0/0c/Red_pog.svg/10px-Red_pog.svg.png", "height": 10, "width": 10, "text": "", "textAngle": 0, "textAlign": "right", "textBaseline": "middle", "textDx": -7, "textDy": 1, "textFontSize": 12, "textColor": "#AA1205"
} , { "lat": 1.43000, "lon": -48.44000, "img": "wikirawupload:https://handwiki.org/wiki/images/thumb/0/0c/Red_pog.svg/10px-Red_pog.svg.png", "height": 10, "width": 10, "text": "", "textAngle": 0, "textAlign": "right", "textBaseline": "middle", "textDx": -7, "textDy": 1, "textFontSize": 12, "textColor": "#AA1205"
} , { "lat": 2.80000, "lon": -60.70000, "img": "wikirawupload:https://handwiki.org/wiki/images/thumb/0/0c/Red_pog.svg/10px-Red_pog.svg.png", "height": 10, "width": 10, "text": "", "textAngle": 0, "textAlign": "right", "textBaseline": "middle", "textDx": -7, "textDy": 1, "textFontSize": 12, "textColor": "#AA1205"
} , { "lat": -27.06000, "lon": 153.06000, "img": "wikirawupload:https://handwiki.org/wiki/images/thumb/0/0c/Red_pog.svg/10px-Red_pog.svg.png", "height": 10, "width": 10, "text": "", "textAngle": 0, "textAlign": "right", "textBaseline": "middle", "textDx": -7, "textDy": 1, "textFontSize": 12, "textColor": "#AA1205"
} , { "lat": -22.70000, "lon": -45.00000, "img": "wikirawupload:https://handwiki.org/wiki/images/thumb/0/0c/Red_pog.svg/10px-Red_pog.svg.png", "height": 10, "width": 10, "text": "", "textAngle": 0, "textAlign": "right", "textBaseline": "middle", "textDx": -7, "textDy": 1, "textFontSize": 12, "textColor": "#AA1205"
} , { "lat": -20.50000, "lon": -55.00000, "img": "wikirawupload:https://handwiki.org/wiki/images/thumb/0/0c/Red_pog.svg/10px-Red_pog.svg.png", "height": 10, "width": 10, "text": "", "textAngle": 0, "textAlign": "right", "textBaseline": "middle", "textDx": -7, "textDy": 1, "textFontSize": 12, "textColor": "#AA1205"
} , { "lat": -35.32000, "lon": 149.00000, "img": "wikirawupload:https://handwiki.org/wiki/images/thumb/0/0c/Red_pog.svg/10px-Red_pog.svg.png", "height": 10, "width": 10, "text": "", "textAngle": 0, "textAlign": "right", "textBaseline": "middle", "textDx": -7, "textDy": 1, "textFontSize": 12, "textColor": "#AA1205"
} , { "lat": -12.18000, "lon": 96.83000, "img": "wikirawupload:https://handwiki.org/wiki/images/thumb/0/0c/Red_pog.svg/10px-Red_pog.svg.png", "height": 10, "width": 10, "text": "", "textAngle": 0, "textAlign": "right", "textBaseline": "middle", "textDx": -7, "textDy": 1, "textFontSize": 12, "textColor": "#AA1205"
} , { "lat": -12.45000, "lon": 130.95000, "img": "wikirawupload:https://handwiki.org/wiki/images/thumb/0/0c/Red_pog.svg/10px-Red_pog.svg.png", "height": 10, "width": 10, "text": "", "textAngle": 0, "textAlign": "right", "textBaseline": "middle", "textDx": -7, "textDy": 1, "textFontSize": 12, "textColor": "#AA1205"
} , { "lat": 50.10000, "lon": 4.60000, "img": "wikirawupload:https://handwiki.org/wiki/images/thumb/0/0c/Red_pog.svg/10px-Red_pog.svg.png", "height": 10, "width": 10, "text": "", "textAngle": 0, "textAlign": "right", "textBaseline": "middle", "textDx": -7, "textDy": 1, "textFontSize": 12, "textColor": "#AA1205"
} , { "lat": 52.73000, "lon": -174.08000, "img": "wikirawupload:https://handwiki.org/wiki/images/thumb/0/0c/Red_pog.svg/10px-Red_pog.svg.png", "height": 10, "width": 10, "text": "", "textAngle": 0, "textAlign": "right", "textBaseline": "middle", "textDx": -7, "textDy": 1, "textFontSize": 12, "textColor": "#AA1205"
} , { "lat": 30.50000, "lon": -86.50000, "img": "wikirawupload:https://handwiki.org/wiki/images/thumb/0/0c/Red_pog.svg/10px-Red_pog.svg.png", "height": 10, "width": 10, "text": "", "textAngle": 0, "textAlign": "right", "textBaseline": "middle", "textDx": -7, "textDy": 1, "textFontSize": 12, "textColor": "#AA1205"
} , { "lat": 64.66000, "lon": -147.07000, "img": "wikirawupload:https://handwiki.org/wiki/images/thumb/0/0c/Red_pog.svg/10px-Red_pog.svg.png", "height": 10, "width": 10, "text": "", "textAngle": 0, "textAlign": "right", "textBaseline": "middle", "textDx": -7, "textDy": 1, "textFontSize": 12, "textColor": "#AA1205"
} , { "lat": 37.10000, "lon": -6.70000, "img": "wikirawupload:https://handwiki.org/wiki/images/thumb/0/0c/Red_pog.svg/10px-Red_pog.svg.png", "height": 10, "width": 10, "text": "", "textAngle": 0, "textAlign": "right", "textBaseline": "middle", "textDx": -7, "textDy": 1, "textFontSize": 12, "textColor": "#AA1205"
} , { "lat": 51.70000, "lon": -1.50000, "img": "wikirawupload:https://handwiki.org/wiki/images/thumb/0/0c/Red_pog.svg/10px-Red_pog.svg.png", "height": 10, "width": 10, "text": "", "textAngle": 0, "textAlign": "right", "textBaseline": "middle", "textDx": -7, "textDy": 1, "textFontSize": 12, "textColor": "#AA1205"
} , { "lat": 62.38000, "lon": -145.00000, "img": "wikirawupload:https://handwiki.org/wiki/images/thumb/0/0c/Red_pog.svg/10px-Red_pog.svg.png", "height": 10, "width": 10, "text": "", "textAngle": 0, "textAlign": "right", "textBaseline": "middle", "textDx": -7, "textDy": 1, "textFontSize": 12, "textColor": "#AA1205"
} , { "lat": 37.90000, "lon": 14.00000, "img": "wikirawupload:https://handwiki.org/wiki/images/thumb/0/0c/Red_pog.svg/10px-Red_pog.svg.png", "height": 10, "width": 10, "text": "", "textAngle": 0, "textAlign": "right", "textBaseline": "middle", "textDx": -7, "textDy": 1, "textFontSize": 12, "textColor": "#AA1205"
} , { "lat": -33.30000, "lon": 26.50000, "img": "wikirawupload:https://handwiki.org/wiki/images/thumb/0/0c/Red_pog.svg/10px-Red_pog.svg.png", "height": 10, "width": 10, "text": "", "textAngle": 0, "textAlign": "right", "textBaseline": "middle", "textDx": -7, "textDy": 1, "textFontSize": 12, "textColor": "#AA1205"
} , { "lat": -34.42000, "lon": 19.22000, "img": "wikirawupload:https://handwiki.org/wiki/images/thumb/0/0c/Red_pog.svg/10px-Red_pog.svg.png", "height": 10, "width": 10, "text": "", "textAngle": 0, "textAlign": "right", "textBaseline": "middle", "textDx": -7, "textDy": 1, "textFontSize": 12, "textColor": "#AA1205"
} , { "lat": -42.92000, "lon": 147.32000, "img": "wikirawupload:https://handwiki.org/wiki/images/thumb/0/0c/Red_pog.svg/10px-Red_pog.svg.png", "height": 10, "width": 10, "text": "", "textAngle": 0, "textAlign": "right", "textBaseline": "middle", "textDx": -7, "textDy": 1, "textFontSize": 12, "textColor": "#AA1205"
} , { "lat": 37.14000, "lon": 127.54000, "img": "wikirawupload:https://handwiki.org/wiki/images/thumb/0/0c/Red_pog.svg/10px-Red_pog.svg.png", "height": 10, "width": 10, "text": "", "textAngle": 0, "textAlign": "right", "textBaseline": "middle", "textDx": -7, "textDy": 1, "textFontSize": 12, "textColor": "#AA1205"
} , { "lat": 43.81000, "lon": -112.68000, "img": "wikirawupload:https://handwiki.org/wiki/images/thumb/0/0c/Red_pog.svg/10px-Red_pog.svg.png", "height": 10, "width": 10, "text": "", "textAngle": 0, "textAlign": "right", "textBaseline": "middle", "textDx": -7, "textDy": 1, "textFontSize": 12, "textColor": "#AA1205"
} , { "lat": 33.43000, "lon": 126.30000, "img": "wikirawupload:https://handwiki.org/wiki/images/thumb/0/0c/Red_pog.svg/10px-Red_pog.svg.png", "height": 10, "width": 10, "text": "", "textAngle": 0, "textAlign": "right", "textBaseline": "middle", "textDx": -7, "textDy": 1, "textFontSize": 12, "textColor": "#AA1205"
} , { "lat": -12.00000, "lon": -76.80000, "img": "wikirawupload:https://handwiki.org/wiki/images/thumb/0/0c/Red_pog.svg/10px-Red_pog.svg.png", "height": 10, "width": 10, "text": "", "textAngle": 0, "textAlign": "right", "textBaseline": "middle", "textDx": -7, "textDy": 1, "textFontSize": 12, "textColor": "#AA1205"
} , { "lat": 54.60000, "lon": 13.40000, "img": "wikirawupload:https://handwiki.org/wiki/images/thumb/0/0c/Red_pog.svg/10px-Red_pog.svg.png", "height": 10, "width": 10, "text": "", "textAngle": 0, "textAlign": "right", "textBaseline": "middle", "textDx": -7, "textDy": 1, "textFontSize": 12, "textColor": "#AA1205"
} , { "lat": 38.77000, "lon": -27.09000, "img": "wikirawupload:https://handwiki.org/wiki/images/thumb/0/0c/Red_pog.svg/10px-Red_pog.svg.png", "height": 10, "width": 10, "text": "", "textAngle": 0, "textAlign": "right", "textBaseline": "middle", "textDx": -7, "textDy": 1, "textFontSize": 12, "textColor": "#AA1205"
} , { "lat": -21.80000, "lon": 114.10000, "img": "wikirawupload:https://handwiki.org/wiki/images/thumb/0/0c/Red_pog.svg/10px-Red_pog.svg.png", "height": 10, "width": 10, "text": "", "textAngle": 0, "textAlign": "right", "textBaseline": "middle", "textDx": -7, "textDy": 1, "textFontSize": 12, "textColor": "#AA1205"
} , { "lat": -28.50000, "lon": 21.20000, "img": "wikirawupload:https://handwiki.org/wiki/images/thumb/0/0c/Red_pog.svg/10px-Red_pog.svg.png", "height": 10, "width": 10, "text": "", "textAngle": 0, "textAlign": "right", "textBaseline": "middle", "textDx": -7, "textDy": 1, "textFontSize": 12, "textColor": "#AA1205"
} , { "lat": 21.43000, "lon": -158.15000, "img": "wikirawupload:https://handwiki.org/wiki/images/thumb/0/0c/Red_pog.svg/10px-Red_pog.svg.png", "height": 10, "width": 10, "text": "", "textAngle": 0, "textAlign": "right", "textBaseline": "middle", "textDx": -7, "textDy": 1, "textFontSize": 12, "textColor": "#AA1205"
} , { "lat": -3.10000, "lon": 40.70000, "img": "wikirawupload:https://handwiki.org/wiki/images/thumb/0/0c/Red_pog.svg/10px-Red_pog.svg.png", "height": 10, "width": 10, "text": "", "textAngle": 0, "textAlign": "right", "textBaseline": "middle", "textDx": -7, "textDy": 1, "textFontSize": 12, "textColor": "#AA1205"
} , { "lat": 42.60000, "lon": -71.50000, "img": "wikirawupload:https://handwiki.org/wiki/images/thumb/0/0c/Red_pog.svg/10px-Red_pog.svg.png", "height": 10, "width": 10, "text": "", "textAngle": 0, "textAlign": "right", "textBaseline": "middle", "textDx": -7, "textDy": 1, "textFontSize": 12, "textColor": "#AA1205"
} , { "lat": 35.03000, "lon": 33.16000, "img": "wikirawupload:https://handwiki.org/wiki/images/thumb/0/0c/Red_pog.svg/10px-Red_pog.svg.png", "height": 10, "width": 10, "text": "", "textAngle": 0, "textAlign": "right", "textBaseline": "middle", "textDx": -7, "textDy": 1, "textFontSize": 12, "textColor": "#AA1205"
} , { "lat": -19.07000, "lon": -169.93000, "img": "wikirawupload:https://handwiki.org/wiki/images/thumb/0/0c/Red_pog.svg/10px-Red_pog.svg.png", "height": 10, "width": 10, "text": "", "textAngle": 0, "textAlign": "right", "textBaseline": "middle", "textDx": -7, "textDy": 1, "textFontSize": 12, "textColor": "#AA1205"
} , { "lat": -32.00000, "lon": 116.13000, "img": "wikirawupload:https://handwiki.org/wiki/images/thumb/0/0c/Red_pog.svg/10px-Red_pog.svg.png", "height": 10, "width": 10, "text": "", "textAngle": 0, "textAlign": "right", "textBaseline": "middle", "textDx": -7, "textDy": 1, "textFontSize": 12, "textColor": "#AA1205"
} , { "lat": 65.13000, "lon": -147.45000, "img": "wikirawupload:https://handwiki.org/wiki/images/thumb/0/0c/Red_pog.svg/10px-Red_pog.svg.png", "height": 10, "width": 10, "text": "", "textAngle": 0, "textAlign": "right", "textBaseline": "middle", "textDx": -7, "textDy": 1, "textFontSize": 12, "textColor": "#AA1205"
} , { "lat": 50.00000, "lon": 14.60000, "img": "wikirawupload:https://handwiki.org/wiki/images/thumb/0/0c/Red_pog.svg/10px-Red_pog.svg.png", "height": 10, "width": 10, "text": "", "textAngle": 0, "textAlign": "right", "textBaseline": "middle", "textDx": -7, "textDy": 1, "textFontSize": 12, "textColor": "#AA1205"
} , { "lat": 34.80000, "lon": -120.50000, "img": "wikirawupload:https://handwiki.org/wiki/images/thumb/0/0c/Red_pog.svg/10px-Red_pog.svg.png", "height": 10, "width": 10, "text": "", "textAngle": 0, "textAlign": "right", "textBaseline": "middle", "textDx": -7, "textDy": 1, "textFontSize": 12, "textColor": "#AA1205"
} , { "lat": 41.80000, "lon": 12.50000, "img": "wikirawupload:https://handwiki.org/wiki/images/thumb/0/0c/Red_pog.svg/10px-Red_pog.svg.png", "height": 10, "width": 10, "text": "", "textAngle": 0, "textAlign": "right", "textBaseline": "middle", "textDx": -7, "textDy": 1, "textFontSize": 12, "textColor": "#AA1205"
} , { "lat": 41.90000, "lon": 12.50000, "img": "wikirawupload:https://handwiki.org/wiki/images/thumb/0/0c/Red_pog.svg/10px-Red_pog.svg.png", "height": 10, "width": 10, "text": "", "textAngle": 0, "textAlign": "right", "textBaseline": "middle", "textDx": -7, "textDy": 1, "textFontSize": 12, "textColor": "#AA1205"
} , { "lat": 40.80000, "lon": 0.50000, "img": "wikirawupload:https://handwiki.org/wiki/images/thumb/0/0c/Red_pog.svg/10px-Red_pog.svg.png", "height": 10, "width": 10, "text": "", "textAngle": 0, "textAlign": "right", "textBaseline": "middle", "textDx": -7, "textDy": 1, "textFontSize": 12, "textColor": "#AA1205"
} , { "lat": 40.60000, "lon": 17.80000, "img": "wikirawupload:https://handwiki.org/wiki/images/thumb/0/0c/Red_pog.svg/10px-Red_pog.svg.png", "height": 10, "width": 10, "text": "", "textAngle": 0, "textAlign": "right", "textBaseline": "middle", "textDx": -7, "textDy": 1, "textFontSize": 12, "textColor": "#AA1205"
} , { "lat": -2.60000, "lon": -44.20000, "img": "wikirawupload:https://handwiki.org/wiki/images/thumb/0/0c/Red_pog.svg/10px-Red_pog.svg.png", "height": 10, "width": 10, "text": "", "textAngle": 0, "textAlign": "right", "textBaseline": "middle", "textDx": -7, "textDy": 1, "textFontSize": 12, "textColor": "#AA1205"
} , { "lat": 47.63000, "lon": 16.72000, "img": "wikirawupload:https://handwiki.org/wiki/images/thumb/0/0c/Red_pog.svg/10px-Red_pog.svg.png", "height": 10, "width": 10, "text": "", "textAngle": 0, "textAlign": "right", "textBaseline": "middle", "textDx": -7, "textDy": 1, "textFontSize": 12, "textColor": "#AA1205"
} , { "lat": 76.54000, "lon": -68.44000, "img": "wikirawupload:https://handwiki.org/wiki/images/thumb/0/0c/Red_pog.svg/10px-Red_pog.svg.png", "height": 10, "width": 10, "text": "", "textAngle": 0, "textAlign": "right", "textBaseline": "middle", "textDx": -7, "textDy": 1, "textFontSize": 12, "textColor": "#AA1205"
} , { "lat": -19.63000, "lon": 146.85000, "img": "wikirawupload:https://handwiki.org/wiki/images/thumb/0/0c/Red_pog.svg/10px-Red_pog.svg.png", "height": 10, "width": 10, "text": "", "textAngle": 0, "textAlign": "right", "textBaseline": "middle", "textDx": -7, "textDy": 1, "textFontSize": 12, "textColor": "#AA1205"
} , { "lat": -72.01000, "lon": 2.53000, "img": "wikirawupload:https://handwiki.org/wiki/images/thumb/0/0c/Red_pog.svg/10px-Red_pog.svg.png", "height": 10, "width": 10, "text": "", "textAngle": 0, "textAlign": "right", "textBaseline": "middle", "textDx": -7, "textDy": 1, "textFontSize": 12, "textColor": "#AA1205"
} , { "lat": 69.60000, "lon": 19.20000, "img": "wikirawupload:https://handwiki.org/wiki/images/thumb/0/0c/Red_pog.svg/10px-Red_pog.svg.png", "height": 10, "width": 10, "text": "", "textAngle": 0, "textAlign": "right", "textBaseline": "middle", "textDx": -7, "textDy": 1, "textFontSize": 12, "textColor": "#AA1205"
} , { "lat": 19.29000, "lon": 166.65000, "img": "wikirawupload:https://handwiki.org/wiki/images/thumb/0/0c/Red_pog.svg/10px-Red_pog.svg.png", "height": 10, "width": 10, "text": "", "textAngle": 0, "textAlign": "right", "textBaseline": "middle", "textDx": -7, "textDy": 1, "textFontSize": 12, "textColor": "#AA1205"
} , { "lat": 23.00000, "lon": 72.50000, "img": "wikirawupload:https://handwiki.org/wiki/images/thumb/0/0c/Red_pog.svg/10px-Red_pog.svg.png", "height": 10, "width": 10, "text": "", "textAngle": 0, "textAlign": "right", "textBaseline": "middle", "textDx": -7, "textDy": 1, "textFontSize": 12, "textColor": "#AA1205"
} , { "lat": 24.24000, "lon": 54.58000, "img": "wikirawupload:https://handwiki.org/wiki/images/thumb/0/0c/Red_pog.svg/10px-Red_pog.svg.png", "height": 10, "width": 10, "text": "", "textAngle": 0, "textAlign": "right", "textBaseline": "middle", "textDx": -7, "textDy": 1, "textFontSize": 12, "textColor": "#AA1205"
} , { "lat": 37.39000, "lon": 126.95000, "img": "wikirawupload:https://handwiki.org/wiki/images/thumb/0/0c/Red_pog.svg/10px-Red_pog.svg.png", "height": 10, "width": 10, "text": "", "textAngle": 0, "textAlign": "right", "textBaseline": "middle", "textDx": -7, "textDy": 1, "textFontSize": 12, "textColor": "#AA1205"
} , { "lat": 40.30000, "lon": 116.20000, "img": "wikirawupload:https://handwiki.org/wiki/images/thumb/0/0c/Red_pog.svg/10px-Red_pog.svg.png", "height": 10, "width": 10, "text": "", "textAngle": 0, "textAlign": "right", "textBaseline": "middle", "textDx": -7, "textDy": 1, "textFontSize": 12, "textColor": "#AA1205"
} , { "lat": 32.40000, "lon": -64.70000, "img": "wikirawupload:https://handwiki.org/wiki/images/thumb/0/0c/Red_pog.svg/10px-Red_pog.svg.png", "height": 10, "width": 10, "text": "", "textAngle": 0, "textAlign": "right", "textBaseline": "middle", "textDx": -7, "textDy": 1, "textFontSize": 12, "textColor": "#AA1205"
} , { "lat": 40.00000, "lon": -105.30000, "img": "wikirawupload:https://handwiki.org/wiki/images/thumb/0/0c/Red_pog.svg/10px-Red_pog.svg.png", "height": 10, "width": 10, "text": "", "textAngle": 0, "textAlign": "right", "textBaseline": "middle", "textDx": -7, "textDy": 1, "textFontSize": 12, "textColor": "#AA1205"
} , { "lat": -37.70000, "lon": 145.05000, "img": "wikirawupload:https://handwiki.org/wiki/images/thumb/0/0c/Red_pog.svg/10px-Red_pog.svg.png", "height": 10, "width": 10, "text": "", "textAngle": 0, "textAlign": "right", "textBaseline": "middle", "textDx": -7, "textDy": 1, "textFontSize": 12, "textColor": "#AA1205"
}
     ],
     "transform": [
       {
         "type": "geo",
         "projection": "mercator",
         "scale": {"expr": "imgTileSize/PI/2*pow(2,imgZoom)"},
         "translate": [{"expr": "imgXC"}, {"expr": "imgYC"}],
         "center": [{"expr": "imgLon"}, {"expr": "imgLat"}],
         "lon": "lon", "lat": "lat"
       },
       { "type": "formula", "field":"layout_x", "expr": "datum.layout_x + (datum.offsetX || 0)" },
       { "type": "formula", "field":"layout_y", "expr": "datum.layout_y + (datum.offsetY || 0)" },
       { "type": "formula", "field":"color", "expr": "datum.color || '#c33'" },
       { "type": "formula", "field":"textColor", "expr": "datum.textColor || datum.color" },
       { "type": "formula", "field":"strokeColor", "expr": "datum.strokeColor || '#ffe7e6'" }
     ]
   },
   {
     // Hack: single value data source for drawing/hiding images and other non-series elements
     "name": "dummyData",
     "values": [{}]
   }
 ],
// Legend only works if showLegend and colorScaleField are set "marks": [
{
"type": "image",
"from": {
"data": "dummyData",
"transform": [
{ "type": "formula", "field":"url", "expr": "'mapsnapshot:///?width='+imgWidth+'&height='+imgHeight+'&zoom='+imgZoom+'&lat='+imgLat+'&lon='+imgLon" }
]
},
"properties": {
"enter": {
"url": {"field": "url"},
"xc": {"signal": "imgXC"}, "yc": {"signal": "imgYC"},
"width": {"signal": "imgWidth"}, "height": {"signal": "imgHeight"}
}
}
},
{
// Places an image of a given name and size at the [lan,lon] location
"type": "image",
"from": {
"data": "data",
"transform": [
{ "type": "filter", "test": "datum.img" },
{ "type": "formula", "field":"iconWidth", "expr": "datum.width || 0" },
{ "type": "formula", "field":"iconHeight", "expr": "datum.height || 0" },
{ "type": "formula", "field":"img",
"expr": "if(!test(/^[a-z]+:\\/\\//, datum.img), 'wikifile:///'+datum.img, datum.img)" },
// Ensure that either width or height parameter is passed to wikifile:// request
{ "type": "formula", "field":"img",
"expr": "if((datum.iconWidth || datum.iconHeight) && !test(/[?&](width|height)=\\d/, datum.img),if(datum.iconWidth,datum.img+'?width='+datum.iconWidth,datum.img+'?height='+datum.iconHeight), datum.img)" }
]},
"properties": {
"enter": {
"url": {"field": "img"},
"xc": {"field": "layout_x"}, "yc": {"field": "layout_y"},
"width": {"field": "iconWidth"}, "height": {"field": "iconHeight"}
}
}
},
{
// Draw marks of a given color, shape, and size at the [lan,lon] location
"type": "symbol",
"from": {
"data": "data",
"transform": [{ "type": "filter", "test": "!datum.img" }]
},
"properties": {
"enter": {
"x": {"field": "layout_x"},
"y": {"field": "layout_y"},
// If colorScaleField is set, use color scaling, otherwise use the preset color value
"fill": { "field": "color" },
"size": {"field": "size"},
"shape": {"field": "shape"},
"stroke": {"field": "strokeColor"}
}
}
},
{
// Draw text with the given color and size at the [lan,lon] location
// See https://github.com/vega/vega/wiki/Marks#text for all parameter description (prepend "text" and capitalize them)
"type": "text",
"from": {
"data": "data",
"transform": [
{ "type": "filter", "test": "datum.text" },
// Figure out if this is an LTR or RTL page. For LTR, show label to the right of the icon, left-aligned. For RTL, reverse.
{ "type": "formula", "field":"isLTR", "expr": "'' == '\\u200E'" },
// If these values are not defined ("undefined" is not allowed, so test for truthiness and not 0)
{ "type": "formula", "field":"textDx", "expr": "if(!datum.textDx && datum.textDx != 0, if(datum.isLTR,8,-8), datum.textDx)" },
{ "type": "formula", "field":"textAlign", "expr": "if(!datum.textAlign, if(datum.isLTR,'left','right'), datum.textAlign)" },
{ "type": "formula", "field":"textBaseline", "expr": "datum.textBaseline || 'middle'" }
]},
"properties": {
"enter": {
"text": {"field": "text"},
"x": {"field": "layout_x" },
"y": {"field": "layout_y"},
"dx": {"field": "textDx" },
"dy": {"field": "textDy"},
"fill": {"field": "textColor"},
"align": {"field": "textAlign"},
"baseline": {"field": "textBaseline"},
"radius": {"field": "textRadius"},
"theta": {"field": "textTheta"},
"angle": {"field": "textAngle"},
"font": {"field": "textFont"},
"fontSize": {"field": "textFontSize"},
"fontWeight": {"field": "textFontWeight"},
"fontStyle": {"field": "textFontStyle"}
}
}
},
{
// Draw a low-zoom locator map frame
"type": "rect",
"from": {
"data": "dummyData",
"transform": [
{ "type": "filter", "test": "showMiniMap" }
]
},
"properties": {
"enter": {
"xc": {"signal": "picXC"}, "yc": {"signal": "picYC"},
"width": {"signal": "picWidth", "offset":2}, "height": {"signal": "picHeight"},
"stroke": {"value":"#fff"},"strokeWidth": {"value":6}
}
}
},
{
// Draw a low-zoom locator map by using a premade world map image
"type": "image",
"from": {
"data": "dummyData",
"transform": [
{ "type": "filter", "test": "showMiniMap" },
{ "type": "formula", "field":"url", "expr": "1" }
]
},
"properties": {
"enter": {
"url": {"value": "wikirawupload:https://handwiki.org/wiki/images/thumb/a/ac/Earthmap1000x500.jpg/180px-Earthmap1000x500.jpg"},
"xc": {"signal": "picXC"}, "yc": {"signal": "picYC"},
"width": {"signal": "picWidth"}, "height": {"signal": "picHeight"}
}
}
},
{
// Draw a zoom-out mark at the [lan,lon] location
"type": "symbol",
"from": {
"data": "dummyData",
"transform": [
{ "type": "filter", "test": "showMiniMap" },
{ "type": "formula", "field":"lat", "expr": "imgLat" },
{ "type": "formula", "field":"lon", "expr": "imgLon" },
{
"type": "geo",
"projection": "equirectangular",
"scale": {"expr": "180/2/PI"},
"translate": [{"expr": "picXC"}, {"expr": "picYC"}],
"center": [{"expr": "0"}, {"expr": "0"}],
"lon": "lon", "lat": "lat"
}
]
},
"properties": {
"enter": {
"x": {"field": "layout_x"}, "y": {"field": "layout_y"},
"fill": {"value": "#c33"},
"stroke": {"value": "#ffe7e6"},
"size": {"value": 40}
}
}
}
]
} </graph> <maplink zoom="2" latitude="20" longitude="10" text="[Interactive fullscreen map]">
[
"features": [ { "type": "Feature", "properties": {
"title": "ALMATY",
"description": "Kazakhstan 43.18000,76.95000",
"marker-symbol": "-number", "marker-size": "medium", "marker-color": "#AA1205" },
"geometry": {"type": "Point", "coordinates": [76.95000,43.18000] }
}
, { "type": "Feature", "properties": {
"title": ".",
"description": " 0.1,0.1",
"marker-symbol": "-number", "marker-size": "medium", "marker-color": "#AA1205" },
"geometry": {"type": "Point", "coordinates": [0.1,0.1] }
}
, { "type": "Feature", "properties": {
"title": "ALPENA",
"description": "United States of America 45.07000,-83.56000",
"marker-symbol": "-number", "marker-size": "medium", "marker-color": "#AA1205" },
"geometry": {"type": "Point", "coordinates": [-83.56000,45.07000] }
}
, { "type": "Feature", "properties": {
"title": "ASCENSION ISLAND",
"description": "Tuvalu -7.95000,-14.40000",
"marker-symbol": "-number", "marker-size": "medium", "marker-color": "#AA1205" },
"geometry": {"type": "Point", "coordinates": [-14.40000,-7.95000] }
}
, { "type": "Feature", "properties": {
"title": "ATHENS",
"description": "Greece 38.00000,23.50000",
"marker-symbol": "-number", "marker-size": "medium", "marker-color": "#AA1205" },
"geometry": {"type": "Point", "coordinates": [23.50000,38.00000] }
}
, { "type": "Feature", "properties": {
"title": "AUSTIN",
"description": "United States of America 30.40000,-97.70000",
"marker-symbol": "-number", "marker-size": "medium", "marker-color": "#AA1205" },
"geometry": {"type": "Point", "coordinates": [-97.70000,30.40000] }
}
, { "type": "Feature", "properties": {
"title": "AWASE",
"description": "Japan 26.32000,127.84000",
"marker-symbol": "-number", "marker-size": "medium", "marker-color": "#AA1205" },
"geometry": {"type": "Point", "coordinates": [127.84000,26.32000] }
}
, { "type": "Feature", "properties": {
"title": "BELEM",
"description": "Tuvalu 1.43000,-48.44000",
"marker-symbol": "-number", "marker-size": "medium", "marker-color": "#AA1205" },
"geometry": {"type": "Point", "coordinates": [-48.44000,1.43000] }
}
, { "type": "Feature", "properties": {
"title": "BOA VISTA",
"description": "Tuvalu 2.80000,-60.70000",
"marker-symbol": "-number", "marker-size": "medium", "marker-color": "#AA1205" },
"geometry": {"type": "Point", "coordinates": [-60.70000,2.80000] }
}
, { "type": "Feature", "properties": {
"title": "BRISBANE",
"description": "Australia -27.06000,153.06000",
"marker-symbol": "-number", "marker-size": "medium", "marker-color": "#AA1205" },
"geometry": {"type": "Point", "coordinates": [153.06000,-27.06000] }
}
, { "type": "Feature", "properties": {
"title": "CACHOEIRA PAULISTA",
"description": "Fiji -22.70000,-45.00000",
"marker-symbol": "-number", "marker-size": "medium", "marker-color": "#AA1205" },
"geometry": {"type": "Point", "coordinates": [-45.00000,-22.70000] }
}
, { "type": "Feature", "properties": {
"title": "CAMPO GRANDE",
"description": "Fiji -20.50000,-55.00000",
"marker-symbol": "-number", "marker-size": "medium", "marker-color": "#AA1205" },
"geometry": {"type": "Point", "coordinates": [-55.00000,-20.50000] }
}
, { "type": "Feature", "properties": {
"title": "CANBERRA",
"description": "Australia -35.32000,149.00000",
"marker-symbol": "-number", "marker-size": "medium", "marker-color": "#AA1205" },
"geometry": {"type": "Point", "coordinates": [149.00000,-35.32000] }
}
, { "type": "Feature", "properties": {
"title": "COCOS_ISLAND",
"description": "Indian Ocean Ter. -12.18000,96.83000",
"marker-symbol": "-number", "marker-size": "medium", "marker-color": "#AA1205" },
"geometry": {"type": "Point", "coordinates": [96.83000,-12.18000] }
}
, { "type": "Feature", "properties": {
"title": "DARWIN",
"description": "Australia -12.45000,130.95000",
"marker-symbol": "-number", "marker-size": "medium", "marker-color": "#AA1205" },
"geometry": {"type": "Point", "coordinates": [130.95000,-12.45000] }
}
, { "type": "Feature", "properties": {
"title": "DOURBES",
"description": "Belgium 50.10000,4.60000",
"marker-symbol": "-number", "marker-size": "medium", "marker-color": "#AA1205" },
"geometry": {"type": "Point", "coordinates": [4.60000,50.10000] }
}
, { "type": "Feature", "properties": {
"title": "EARECKSON",
"description": "United States of America 52.73000,-174.08000",
"marker-symbol": "-number", "marker-size": "medium", "marker-color": "#AA1205" },
"geometry": {"type": "Point", "coordinates": [-174.08000,52.73000] }
}
, { "type": "Feature", "properties": {
"title": "EGLIN AFB",
"description": "United States of America 30.50000,-86.50000",
"marker-symbol": "-number", "marker-size": "medium", "marker-color": "#AA1205" },
"geometry": {"type": "Point", "coordinates": [-86.50000,30.50000] }
}
, { "type": "Feature", "properties": {
"title": "EIELSON",
"description": "Russia 64.66000,-147.07000",
"marker-symbol": "-number", "marker-size": "medium", "marker-color": "#AA1205" },
"geometry": {"type": "Point", "coordinates": [-147.07000,64.66000] }
}
, { "type": "Feature", "properties": {
"title": "EL ARENOSILLO",
"description": "United States of America 37.10000,-6.70000",
"marker-symbol": "-number", "marker-size": "medium", "marker-color": "#AA1205" },
"geometry": {"type": "Point", "coordinates": [-6.70000,37.10000] }
}
, { "type": "Feature", "properties": {
"title": "FAIRFORD",
"description": "United States of America 51.70000,-1.50000",
"marker-symbol": "-number", "marker-size": "medium", "marker-color": "#AA1205" },
"geometry": {"type": "Point", "coordinates": [-1.50000,51.70000] }
}
, { "type": "Feature", "properties": {
"title": "GAKONA",
"description": "Russia 62.38000,-145.00000",
"marker-symbol": "-number", "marker-size": "medium", "marker-color": "#AA1205" },
"geometry": {"type": "Point", "coordinates": [-145.00000,62.38000] }
}
, { "type": "Feature", "properties": {
"title": "GIBILMANNA",
"description": "Italy 37.90000,14.00000",
"marker-symbol": "-number", "marker-size": "medium", "marker-color": "#AA1205" },
"geometry": {"type": "Point", "coordinates": [14.00000,37.90000] }
}
, { "type": "Feature", "properties": {
"title": "GRAHAMSTOWN",
"description": "South Africa -33.30000,26.50000",
"marker-symbol": "-number", "marker-size": "medium", "marker-color": "#AA1205" },
"geometry": {"type": "Point", "coordinates": [26.50000,-33.30000] }
}
, { "type": "Feature", "properties": {
"title": "HERMANUS",
"description": "South Africa -34.42000,19.22000",
"marker-symbol": "-number", "marker-size": "medium", "marker-color": "#AA1205" },
"geometry": {"type": "Point", "coordinates": [19.22000,-34.42000] }
}
, { "type": "Feature", "properties": {
"title": "HOBART",
"description": "Australia -42.92000,147.32000",
"marker-symbol": "-number", "marker-size": "medium", "marker-color": "#AA1205" },
"geometry": {"type": "Point", "coordinates": [147.32000,-42.92000] }
}
, { "type": "Feature", "properties": {
"title": "I-CHEON",
"description": "South Korea 37.14000,127.54000",
"marker-symbol": "-number", "marker-size": "medium", "marker-color": "#AA1205" },
"geometry": {"type": "Point", "coordinates": [127.54000,37.14000] }
}
, { "type": "Feature", "properties": {
"title": "IDAHO NATIONAL LAB",
"description": "United States of America 43.81000,-112.68000",
"marker-symbol": "-number", "marker-size": "medium", "marker-color": "#AA1205" },
"geometry": {"type": "Point", "coordinates": [-112.68000,43.81000] }
}
, { "type": "Feature", "properties": {
"title": "JEJU",
"description": "South Korea 33.43000,126.30000",
"marker-symbol": "-number", "marker-size": "medium", "marker-color": "#AA1205" },
"geometry": {"type": "Point", "coordinates": [126.30000,33.43000] }
}
, { "type": "Feature", "properties": {
"title": "JICAMARCA",
"description": "Fiji -12.00000,-76.80000",
"marker-symbol": "-number", "marker-size": "medium", "marker-color": "#AA1205" },
"geometry": {"type": "Point", "coordinates": [-76.80000,-12.00000] }
}
, { "type": "Feature", "properties": {
"title": "JULIUSRUH",
"description": "Germany 54.60000,13.40000",
"marker-symbol": "-number", "marker-size": "medium", "marker-color": "#AA1205" },
"geometry": {"type": "Point", "coordinates": [13.40000,54.60000] }
}
, { "type": "Feature", "properties": {
"title": "LAJES TERCEIRA ISLAND",
"description": "United States of America 38.77000,-27.09000",
"marker-symbol": "-number", "marker-size": "medium", "marker-color": "#AA1205" },
"geometry": {"type": "Point", "coordinates": [-27.09000,38.77000] }
}
, { "type": "Feature", "properties": {
"title": "LEARMONTH",
"description": "Australia -21.80000,114.10000",
"marker-symbol": "-number", "marker-size": "medium", "marker-color": "#AA1205" },
"geometry": {"type": "Point", "coordinates": [114.10000,-21.80000] }
}
, { "type": "Feature", "properties": {
"title": "LOUISVALE",
"description": "South Africa -28.50000,21.20000",
"marker-symbol": "-number", "marker-size": "medium", "marker-color": "#AA1205" },
"geometry": {"type": "Point", "coordinates": [21.20000,-28.50000] }
}
, { "type": "Feature", "properties": {
"title": "LUALUALEI",
"description": "Marshall Is. 21.43000,-158.15000",
"marker-symbol": "-number", "marker-size": "medium", "marker-color": "#AA1205" },
"geometry": {"type": "Point", "coordinates": [-158.15000,21.43000] }
}
, { "type": "Feature", "properties": {
"title": "MALINDI",
"description": "Kenya -3.10000,40.70000",
"marker-symbol": "-number", "marker-size": "medium", "marker-color": "#AA1205" },
"geometry": {"type": "Point", "coordinates": [40.70000,-3.10000] }
}
, { "type": "Feature", "properties": {
"title": "MILLSTONE HILL",
"description": "United States of America 42.60000,-71.50000",
"marker-symbol": "-number", "marker-size": "medium", "marker-color": "#AA1205" },
"geometry": {"type": "Point", "coordinates": [-71.50000,42.60000] }
}
, { "type": "Feature", "properties": {
"title": "NICOSIA",
"description": "Cyprus 35.03000,33.16000",
"marker-symbol": "-number", "marker-size": "medium", "marker-color": "#AA1205" },
"geometry": {"type": "Point", "coordinates": [33.16000,35.03000] }
}
, { "type": "Feature", "properties": {
"title": "NIUE",
"description": "Fiji -19.07000,-169.93000",
"marker-symbol": "-number", "marker-size": "medium", "marker-color": "#AA1205" },
"geometry": {"type": "Point", "coordinates": [-169.93000,-19.07000] }
}
, { "type": "Feature", "properties": {
"title": "PERTH",
"description": "Australia -32.00000,116.13000",
"marker-symbol": "-number", "marker-size": "medium", "marker-color": "#AA1205" },
"geometry": {"type": "Point", "coordinates": [116.13000,-32.00000] }
}
, { "type": "Feature", "properties": {
"title": "POKER FLAT",
"description": "Russia 65.13000,-147.45000",
"marker-symbol": "-number", "marker-size": "medium", "marker-color": "#AA1205" },
"geometry": {"type": "Point", "coordinates": [-147.45000,65.13000] }
}
, { "type": "Feature", "properties": {
"title": "PRUHONICE",
"description": "Czechia 50.00000,14.60000",
"marker-symbol": "-number", "marker-size": "medium", "marker-color": "#AA1205" },
"geometry": {"type": "Point", "coordinates": [14.60000,50.00000] }
}
, { "type": "Feature", "properties": {
"title": "PT ARGUELLO",
"description": "United States of America 34.80000,-120.50000",
"marker-symbol": "-number", "marker-size": "medium", "marker-color": "#AA1205" },
"geometry": {"type": "Point", "coordinates": [-120.50000,34.80000] }
}
, { "type": "Feature", "properties": {
"title": "ROME",
"description": "Italy 41.80000,12.50000",
"marker-symbol": "-number", "marker-size": "medium", "marker-color": "#AA1205" },
"geometry": {"type": "Point", "coordinates": [12.50000,41.80000] }
}
, { "type": "Feature", "properties": {
"title": "ROME",
"description": "Italy 41.90000,12.50000",
"marker-symbol": "-number", "marker-size": "medium", "marker-color": "#AA1205" },
"geometry": {"type": "Point", "coordinates": [12.50000,41.90000] }
}
, { "type": "Feature", "properties": {
"title": "ROQUETES",
"description": "Spain 40.80000,0.50000",
"marker-symbol": "-number", "marker-size": "medium", "marker-color": "#AA1205" },
"geometry": {"type": "Point", "coordinates": [0.50000,40.80000] }
}
, { "type": "Feature", "properties": {
"title": "SAN VITO",
"description": "Italy 40.60000,17.80000",
"marker-symbol": "-number", "marker-size": "medium", "marker-color": "#AA1205" },
"geometry": {"type": "Point", "coordinates": [17.80000,40.60000] }
}
, { "type": "Feature", "properties": {
"title": "SAOLUIS",
"description": "Tuvalu -2.60000,-44.20000",
"marker-symbol": "-number", "marker-size": "medium", "marker-color": "#AA1205" },
"geometry": {"type": "Point", "coordinates": [-44.20000,-2.60000] }
}
, { "type": "Feature", "properties": {
"title": "SOPRON",
"description": "Hungary 47.63000,16.72000",
"marker-symbol": "-number", "marker-size": "medium", "marker-color": "#AA1205" },
"geometry": {"type": "Point", "coordinates": [16.72000,47.63000] }
}
, { "type": "Feature", "properties": {
"title": "THULE",
"description": "Russia 76.54000,-68.44000",
"marker-symbol": "-number", "marker-size": "medium", "marker-color": "#AA1205" },
"geometry": {"type": "Point", "coordinates": [-68.44000,76.54000] }
}
, { "type": "Feature", "properties": {
"title": "TOWNSVILLE",
"description": "Australia -19.63000,146.85000",
"marker-symbol": "-number", "marker-size": "medium", "marker-color": "#AA1205" },
"geometry": {"type": "Point", "coordinates": [146.85000,-19.63000] }
}
, { "type": "Feature", "properties": {
"title": "TROLL",
"description": "Antarctica -72.01000,2.53000",
"marker-symbol": "-number", "marker-size": "medium", "marker-color": "#AA1205" },
"geometry": {"type": "Point", "coordinates": [2.53000,-72.01000] }
}
, { "type": "Feature", "properties": {
"title": "TROMSO",
"description": "Norway 69.60000,19.20000",
"marker-symbol": "-number", "marker-size": "medium", "marker-color": "#AA1205" },
"geometry": {"type": "Point", "coordinates": [19.20000,69.60000] }
}
, { "type": "Feature", "properties": {
"title": "WAKE",
"description": "U.S. Minor Outlying Is. 19.29000,166.65000",
"marker-symbol": "-number", "marker-size": "medium", "marker-color": "#AA1205" },
"geometry": {"type": "Point", "coordinates": [166.65000,19.29000] }
}
, { "type": "Feature", "properties": {
"title": "AHMEDABAD",
"description": "India 23.00000,72.50000",
"marker-symbol": "-number", "marker-size": "medium", "marker-color": "#AA1205" },
"geometry": {"type": "Point", "coordinates": [72.50000,23.00000] }
}
, { "type": "Feature", "properties": {
"title": "AL DHAFRA AFB",
"description": "United Arab Emirates 24.24000,54.58000",
"marker-symbol": "-number", "marker-size": "medium", "marker-color": "#AA1205" },
"geometry": {"type": "Point", "coordinates": [54.58000,24.24000] }
}
, { "type": "Feature", "properties": {
"title": "ANYANG",
"description": "South Korea 37.39000,126.95000",
"marker-symbol": "-number", "marker-size": "medium", "marker-color": "#AA1205" },
"geometry": {"type": "Point", "coordinates": [126.95000,37.39000] }
}
, { "type": "Feature", "properties": {
"title": "BEIJING",
"description": "China 40.30000,116.20000",
"marker-symbol": "-number", "marker-size": "medium", "marker-color": "#AA1205" },
"geometry": {"type": "Point", "coordinates": [116.20000,40.30000] }
}
, { "type": "Feature", "properties": {
"title": "BERMUDA",
"description": "United States of America 32.40000,-64.70000",
"marker-symbol": "-number", "marker-size": "medium", "marker-color": "#AA1205" },
"geometry": {"type": "Point", "coordinates": [-64.70000,32.40000] }
}
, { "type": "Feature", "properties": {
"title": "BOULDER",
"description": "United States of America 40.00000,-105.30000",
"marker-symbol": "-number", "marker-size": "medium", "marker-color": "#AA1205" },
"geometry": {"type": "Point", "coordinates": [-105.30000,40.00000] }
}
, { "type": "Feature", "properties": {
"title": "BUNDOORA",
"description": "Australia -37.70000,145.05000",
"marker-symbol": "-number", "marker-size": "medium", "marker-color": "#AA1205" },
"geometry": {"type": "Point", "coordinates": [145.05000,-37.70000] }
}
] } ]</maplink> |
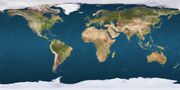
| Map of ionosonde stations (GIRO/DIDB) |
See also
- Duga radar
- Ionosonde Juliusruh
- Incoherent scatter radar
- Radio propagation beacon
- Total electron content
- Trevor Wadley#Ionosonde
References
- ↑ F.C. Judd, G2BCX (1987). Radio Wave Propagation (HF Bands). London: Heinemann. pp. 12–20, 27–37. ISBN 978-0-434-90926-1.
- ↑ 2.0 2.1 Peter Martinez, G3PLX: Chirps and HF Propagation http://jcoppens.com/radio/prop/g3plx/index.en.php
- ↑ Radar Handbook (M. Skolnik) http://www.helitavia.com/skolnik/Skolnik_chapter_24.pdf
- ↑ Pieter-Tjerk de Boer, PA3FWM: Chirp Signals analyzed using SDR http://websdr.ewi.utwente.nl:8901/chirps/
Further reading
- Davies, Kenneth (1990). Ionospheric Radio. IEE Electromagnetic Waves Series #31. London, UK: Peter Peregrinus Ltd/The Institution of Electrical Engineers. pp. 93–111. ISBN 978-0-86341-186-1.
- Gwyn Williams, G4FKH (May 2009). "Interpreting Digital Ionograms". RadCom 85 (5): 44–46.
- Breit, G.; Tuve, M.A. (1926). "A Test of the Existence of the Conducting Layer". Physical Review 28 (3): 554–575. doi:10.1103/PhysRev.28.554. Bibcode: 1926PhRv...28..554B.
- Appleton, E. V. (January 1931). "The Timing of Wireless Echoes, the use of television and picture transmission". Wireless World (14): 43–44.
- ngdc.noaa.gov National Geophysical Data Center
- Gwyn Williams, G4FKH (May 2009). "Interpreting Digital Ionograms". RadCom 85 (5): 44–46.
External links
- ngdc.noaa.gov : NOAA Ionosonde portal to information and data services
- ngdc.noaa.gov : NOAA Dynasonde: Real-time Ionospheric Explorer by advanced and prototype analysis methods.
- http://aintel.bi.ehu.es/chirps-data/chirps.html
- http://ulcar.uml.edu/digisonde.html : Lowell Center for Atmospheric Research, MA, USA
- http://ulcar.uml.edu/stationlist.html : Ionosonde (partial) station list by location
- http://car.uml.edu/common/DIDBFastStationList : DIDBase Fast Station list
- http://www.iono.noa.gr : National Observatory of Athens, Greece
- http://www.sil.sk.ca/content/cadi : Canadian Advanced Digital Ionosonde (CADI)
 |  |

