Physics:Köhler theory

Köhler theory describes the vapor pressure of aqueous aerosol particles in thermodynamic equilibrium with a humid atmosphere. It is used in atmospheric sciences and meteorology to determine the humidity at which a cloud is formed. Köhler theory combines the Kelvin effect, which describes the change in vapor pressure due to a curved surface, with Raoult's Law, which relates the vapor pressure to the solute concentration.[1][2][3] It was initially published in 1936 by Hilding Köhler, Professor of Meteorology in the Uppsala University.
The Köhler equation relates the saturation ratio over an aqueous solution droplet of fixed dry mass to its wet diameter as:[4]with:
- = saturation ratio over the droplet surface defined as , where is the water vapor pressure of the solution droplet and is the vapor pressure of pure water with a flat surface
- = diameter of the solution droplet ("wet" diameter)
- = water activity of the solution droplet
- = surface tension of the solution droplet
- = molar volume of water
- = universal gas constant
- = temperature
In practice, simplified formulations of the Köhler equation are often used.
Köhler curve
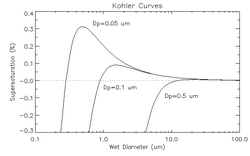
The Köhler curve is the visual representation of the Köhler equation. It shows the saturation ratio – or the supersaturation – at which the droplet is in equilibrium with the environment over a range of droplet diameters. The exact shape of the curve is dependent upon the amount and composition of the solutes present in the atmosphere. The Köhler curves where the solute is sodium chloride are different from when the solute is sodium nitrate or ammonium sulfate.
The figure above shows three Köhler curves of sodium chloride. Consider (for droplets containing solute with a dry diameter equal to 0.05 micrometers) a point on the graph where the wet diameter is 0.1 micrometers and the supersaturation is 0.35%. Since the relative humidity is above 100%, the droplet will grow until it is in thermodynamic equilibrium. As the droplet grows, it never encounters equilibrium, and thus grows without bound, as long as the level of supersaturation is maintained. However, if the supersaturation is only 0.3%, the drop will only grow until about 0.5 micrometers. The supersaturation at which the drop will grow without bound is called the critical supersaturation. The diameter at which the curve peaks is called the critical diameter.
Simplified equations
In practice, simpler versions of the Köhler equation are often used. To derive these, solutes are assumed to be electrolytes that dissociate fully into a fixed number of ions given by the van’t Hoff factor . Also, mixing volumes are neglected and the molar volume of water is calculated by , where and are density and molar mass of water, respectively. It is further assumed that the droplets are dilute at high humidity, which allows the following simplifications:
- Surface tension and density of the droplet are equal to the ones of pure water ()
- The solution is ideal ()
- The number of solute molecules is small compared to the number of water molecules , so and thus
- The amount of water is calculated from the volume of the droplet as , hence neglecting the volume of the solutes.
Given these assumptions, the Köhler equation is simplified to:To further simplify the equation, is approximated by and terms proportional to are neglected. This results in the often used equation:[2][5][6][7][8]with the coefficients and at . This equation allows to analytically derive the critical diameter and critical saturation ratio (given by the maximum of the Köhler curve) as
Another form of the Köhler equation is derived from the logarithmic from of the equation above:
With as , this leads to:[2][3]and
See also
- Cloud condensation nuclei
- Particulates
- Physics:Kelvin equation – Equation describing the change in vapour pressure due to a curved liquid–vapor interface
- Physics:Ostwald–Freundlich equation – Equation describing a phase boundary
- Raoult's Law
References
- ↑ Köhler, Hilding (1936). "The nucleus in and the growth of hygroscopic droplets". Trans. Faraday Soc. 32: 1152–1161. doi:10.1039/tf9363201152. ISSN 0014-7672. http://dx.doi.org/10.1039/tf9363201152.
- ↑ 2.0 2.1 2.2 Pruppacher, Hans R.; Klett, James D. (2010). Microphysics of clouds and precipitation. Atmospheric and oceanographic sciences library (2., rev. and enl. ed., [Nachdr.] ed.). Dordrecht Heidelberg: Springer. ISBN 978-0-7923-4211-3.
- ↑ 3.0 3.1 Seinfeld, John H.; Pandis, Spyros N. (2006). Atmospheric chemistry and physics: from air pollution to climate change (2nd ed.). New York: J. Wiley & sons. ISBN 978-0-471-72017-1.
- ↑ Petters, M. D.; Kreidenweis, S. M. (2007-04-18). "A single parameter representation of hygroscopic growth and cloud condensation nucleus activity" (in English). Atmospheric Chemistry and Physics 7 (8): 1961–1971. doi:10.5194/acp-7-1961-2007. ISSN 1680-7316. https://acp.copernicus.org/articles/7/1961/2007/.
- ↑ Young, Kenneth C. (1993). Microphysical processes in clouds. New York Oxford: Oxford university press. ISBN 978-0-19-507563-2.
- ↑ Lohmann, Ulrike; Lüönd, Felix; Mahrt, Fabian (2016). An introduction to clouds: from the microscale to climate. Cambridge: Cambridge university press. ISBN 978-1-139-08751-3.
- ↑ Rogers, Roddy R.; Rogers, Roddy Rhodes; Yau, Man Kong; Yau, Man K. (1996). A short course in cloud physics. International series in natural philosophy (3. ed., reprint ed.). Woburn, Mass.: Butterworth Heinemann. ISBN 978-0-7506-3215-7.
- ↑ Lamb, Dennis; Verlinde, Johannes (2011). Physics and chemistry of clouds. Cambridge; New York: Cambridge University Press. ISBN 978-0-521-89910-9. OCLC 694393873. https://www.worldcat.org/title/694393873.
fr:Physique des nuages#Condensation
 |
